High-Quality. Stunning Design.
Unique. Relevant. Successful.
Take your manuscript to new heights with Conduct Science Design
High-Quality & Latest Software Used
Image and Table Formatting
After understanding your requirement, our designers and editor will begin working on the images provided using the latest technologies and meeting your expectations
We strive to tell a story
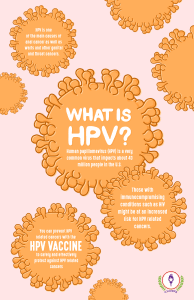
A scientific manuscript has significantly more impact when mixed with visuals. Data visualizations in the form of graphs, charts, diagrams, and infographics help enhance your publication and get it to read, increasing views and increasing its impact on the scientific community. We know how time-consuming and laborious it is to create illustrations that meet all the requirements of different journals and publishing bodies, but our experts are here to help.
Journal Compliance
Formatting, layout resolution, lettering, spacing, scaling, color selection/adjustment, file conversion, we do it all. We’ll do it all and save you time.
Design Experts
Whether its illustrations, graphs, tables, infographics, videos, gifs, or more, Conduct Science have the experts to make attractive graphics for you.
Your Ownership
Scientific images are always yours, our experts sign NDAs and we hand over the raw assets so you can continue to use the files for years to come.
Unrivaled Quality
Our illustrations are presented in the highest quality possible for compatability with multimodal distribution, whether print or digital.
Our Focus

Don’t take our word for it, ask our clients:
Basic Design Services


Have questions? Ask anything!
"*" indicates required fields


