x
[quotes_form]

Distance Travelled in the Centre and Wall Zone: A High-Resolution Metric for Locomotor and Exploratory Profiling in Open Field Analysis

Quick Guide

Learn More about our Services and how can we help you with your research!

Introduction

The Open Field Test (OFT) is a cornerstone tool in behavioral neuroscience, providing a versatile platform for evaluating a wide range of behavioral domains in rodents—including locomotion, anxiety, risk assessment, and environmental exploration. Traditional measures such as time spent in different zones or total distance travelled offer a useful but sometimes oversimplified picture of behavioral patterns. For a more precise and dynamic view of how animals interact with their environment, researchers increasingly focus on zone-specific locomotor metrics, particularly distance travelled in the center and wall zones.

These spatially resolved measures offer a finer-grained understanding of the subject’s emotional reactivity, spatial strategy, and exploratory profile. Whereas general movement data might miss context-specific behavior, distance travelled within clearly defined zones captures both where and how much the animal chooses to move. This provides insights into real-time decision-making, behavioral flexibility, and zone-specific motor engagement—making it a key measure in the phenotyping of psychiatric, neurological, and developmental models.

What Does Distance Travelled by Zone Measure?

Distance travelled in the center and wall zones quantifies how much the subject moves within each designated area of the arena. This metric reflects not just where the animal is located, but how actively it engages with specific environmental regions. Unlike simple zone duration, which captures presence or absence, zone-specific distance captures the quality and intensity of interaction within those spaces.

  • Center Zone Distance: High center zone distance indicates that the animal is not only entering the exposed, high-risk center zone but is also actively exploring it. This is generally interpreted as a sign of novelty-seeking behavior, reduced anxiety, and cognitive flexibility. An animal covering substantial distance in the center is likely confident and behaviorally engaged, showing less concern for potential threats.

  • Wall Zone Distance (Thigmotaxis Zone): High distance traveled in this zone often reflects cautious, anxiety-related exploration, characterized by a preference to stay near protective boundaries. However, when this is accompanied by high overall movement, it may indicate hypervigilant or stress-induced hyperactivity. Low distance in the wall zone may signify either freezing behavior or avoidance due to prior negative associations with that area.

This metric is particularly valuable for distinguishing:

  • Animals that are actively scanning an environment versus those that are passively occupying a space.

  • Emotional inhibition (e.g., anxiety-driven thigmotaxis) from motor suppression (e.g., due to sedation or fatigue).

  • Behavioral flexibility from spatial rigidity, as flexible animals often distribute movement more evenly across zones.

In sum, zone-specific distance travelled transforms spatial presence into a dynamic, interpretable signal of how animals process, respond to, and interact with their environment under various internal states or external conditions.. Rather than simply noting presence (e.g., time spent), this measure captures how actively the animal is engaging with that space. High distance in a particular zone indicates dynamic exploration, while low distance may reflect freezing, cautious surveying, or avoidance.

  • Center Zone Distance: Suggests boldness, novelty-seeking, or reduced anxiety. It represents movement in a high-risk, open area.

  • Wall Zone Distance (Thigmotaxis Zone): Typically associated with cautious exploration, anxiety-like behavior, and risk aversion.

This metric is particularly valuable in distinguishing between animals that passively reside in a zone and those that actively investigate it, helping to differentiate locomotor suppression from emotional inhibition.

Behavioral and Neuroscientific Relevance

1. Anxiety Modulation and Emotional Reactivity

High wall zone distance with low center zone distance often reflects elevated anxiety and thigmotactic behavior. In contrast, increased center distance is generally associated with reduced anxiety and greater exploratory confidence (Prut & Belzung, 2003). This spatial locomotor mapping is highly sensitive to anxiolytic and anxiogenic compounds, making it a reliable endpoint in preclinical pharmacological screening.

2. Spatial Decision-Making and Environmental Engagement

By tracking where and how animals move, zone-specific distance metrics reveal an animal’s decision-making style—whether it’s avoidant, impulsive, systematic, or erratic. For example, a rodent that frequently travels long distances in the wall zone but avoids the center may display habitual risk-avoidant routines. In contrast, an animal that actively explores both zones may exhibit balanced environmental engagement and spatial flexibility.

3. Motor Function vs. Emotional Bias

Zone-specific distance travelled helps disentangle motor impairments from emotional avoidance. An animal with normal total distance but suppressed center zone movement is likely avoiding the center due to perceived threat. Conversely, low movement in both zones may suggest sedation, neuromuscular deficits, or general hypoactivity.

4. Neurocircuitry and Behavioral Phenotyping

Center and wall zone movement patterns reflect the interaction between brain regions regulating emotion (amygdala), spatial memory (hippocampus), decision-making (prefrontal cortex), and movement initiation (basal ganglia). These patterns are commonly used to phenotype models of anxiety, depression, neurodegeneration, and neurodevelopmental disorders.

Methodological Considerations

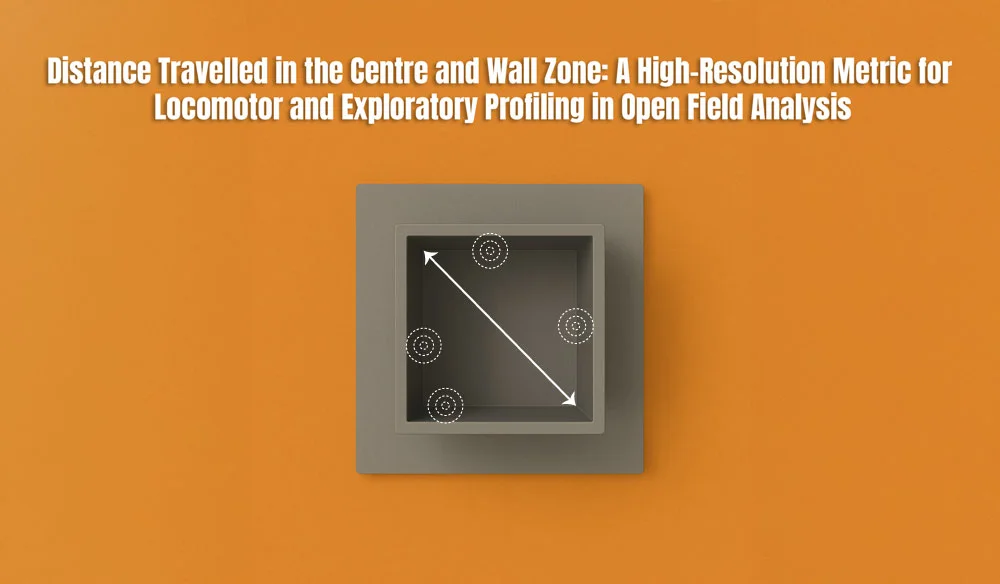
  • Precise Zone Definition: Clearly delineating the center and wall zones is foundational for accurate behavioral analysis. The center zone is typically defined as the inner 25% of the arena, while the wall zone includes the perimeter area within 5–10 cm of the arena edge. The geometry and scale of the arena (square vs. circular) influence how these boundaries are perceived and traversed by the animal. Software-defined zones must be applied consistently across sessions and experiments to maintain data validity.
  • Tracking Calibration: To ensure that zone-specific distance measures are valid, automated tracking systems must be meticulously calibrated. The system should accurately distinguish between genuine locomotor activity and incidental movements such as grooming, body rotations, or momentary pauses. Calibration should include verification of boundary transitions and confirmation that distance metrics are not inflated by noise or jitter in video detection.
  • Session Duration: Trials of 5 to 10 minutes are optimal for assessing exploratory dynamics without inducing habituation or fatigue. Shorter durations may fail to capture the full range of movement behaviors, while excessively long sessions could result in decreased novelty-driven behavior or physical tiredness. Session duration should also be standardized across experimental groups.
  • Environmental Standardization: External factors such as lighting, sound, and ambient odors can profoundly influence zone preference and movement. Use diffuse, non-glare lighting and sound-attenuated rooms to minimize stress or distraction. Ensure the arena is cleaned thoroughly between trials with neutral, scent-free agents to eliminate olfactory cues that could bias exploration.
  • Data Normalization: To control for inter-subject variability in body size, activity levels, or baseline locomotion, distance travelled in each zone should be normalized—either by total distance or by body length units. This allows researchers to draw meaningful comparisons between groups and individuals, focusing on behavioral strategy rather than gross physical differences. Normalization also improves statistical power in cross-cohort analyses. Clearly delineate center and wall zones using high-resolution software. The center zone is typically the inner 25% of the arena; the wall zone includes areas within 5–10 cm from the perimeter.

Interpretation and Integration with Other Metrics

Distance Dynamics Across Time Segments

Analyzing how zone-specific distance evolves over time during the session—early, mid, and late—can offer insight into adaptation, habituation, or sensitization effects. A gradual increase in center zone distance may reflect a reduction in anxiety, while consistent wall-dominant movement may indicate persistent avoidance behavior.

Zone Transition Patterns

Tracking not only where an animal moves but how often and in what sequence it transitions between zones reveals spatial planning and cognitive flexibility. Animals that shift fluidly between center and wall zones tend to display greater environmental engagement and less behavioral rigidity.

Relationship to Stress-Induced Hyperactivity or Hypoactivity

Zone-specific distances help differentiate anxiety-induced hyperactivity (high wall distance, erratic movement) from hypoactivity (low distance in both zones). This discrimination is particularly important when interpreting responses to stressors, pharmacological agents, or neurological lesions.

Integration with Velocity and Acceleration Metrics

Pairing zone-specific distance data with speed-based parameters like average velocity or acceleration profiles offers a richer understanding of emotional arousal and motor control. For instance, fast, shallow center excursions may suggest anxiety-driven darting, while smooth, sustained paths reflect exploratory intent.

Heat Map and Trajectory Visualization

Visual overlays of zone-specific movement (e.g., heat maps, line trajectories) provide intuitive representations of zone preference, scanning styles, and repetitive patterns. These visual tools are ideal for identifying stereotypy, zone neglect, or exploratory biases that are difficult to quantify with numeric distance alone.

  • Time in Zone vs. Distance in Zone: Animals may spend equal time in a zone but differ significantly in how much they move within it. Combining these measures reveals whether behavior is passive (e.g., freezing) or active (e.g., pacing, scanning).
  • Center Entry Frequency: A high number of center entries with low center distance may suggest brief sampling or impulsivity; high distance and frequent entries reflect sustained exploratory behavior.
  • Latency to Center Movement: Time taken before engaging in meaningful movement in the center provides additional insight into emotional and cognitive readiness.
  • Total Distance Traveled: Helps contextualize zone-specific patterns within overall activity level—e.g., high wall distance with normal total distance supports anxiety-based avoidance.

Applications in Translational and Preclinical Research

Disease Progression Tracking in Longitudinal Studies

Zone-specific distance metrics allow researchers to monitor behavioral changes over time, providing sensitive markers of disease onset or therapeutic efficacy. In neurodegenerative models, such as Huntington’s or ALS, progressive reductions in center zone distance may precede gross motor deficits, offering early-stage indicators of functional decline.

Individual Variability and Trait-Based Stratification

High-resolution tracking of zone-specific movement supports the identification of stable behavioral traits, such as novelty-seeking, avoidance, or perseverative exploration. This trait-based approach enhances the reproducibility of findings across cohorts and is particularly valuable in precision medicine research, where behavioral endophenotypes inform subgroup-specific interventions.

Behavioral Predictors of Treatment Response

Baseline patterns of center and wall zone distance can be used to predict treatment responsiveness. Animals with high baseline wall exploration and low center activity may show more pronounced behavioral improvement following anxiolytic or cognitive-enhancing therapy. This predictive capacity can refine subject selection and interpretation in preclinical drug testing.

Integration with Machine Learning-Based Behavioral Profiling

Zone-specific distance data can be used as input features for unsupervised machine learning algorithms to classify animals into behavioral phenotypes. These profiles can then be correlated with genetic, neurophysiological, or histological outcomes, enabling a systems-level understanding of brain-behavior relationships.

  • Anxiolytic Drug Testing: Increased center zone distance following drug administration is a hallmark of anxiolytic efficacy. Wall zone distance remains stable or may decline depending on compound profile.
  • Genetic and Neurodevelopmental Models: Rodents with alterations in serotonergic, dopaminergic, or GABAergic systems show distinct zone-specific movement patterns. These behaviors correlate with emotional dysregulation and cognitive impairments in autism, schizophrenia, and ADHD models.
  • Neurodegeneration and Motor Deficits: Changes in zone-specific distance are used to distinguish cognitive withdrawal from movement impairments in models of Alzheimer’s, Parkinson’s, and Huntington’s disease.
  • Behavioral Stratification: High-resolution spatial movement metrics support classification of behavioral phenotypes into exploratory, avoidant, hypoactive, or risk-prone subtypes.

Enhancing Behavioral Analysis with Integrated Systems

Utilizing advanced open field platforms with automated zone segmentation and high-speed tracking allows researchers to capture nuanced differences in how animals navigate center and wall zones. Integrated software supports real-time heat maps, trajectory overlays, and batch analysis for high-throughput behavioral profiling.

For more robust, reproducible results in behavioral neuroscience, incorporating distance travelled in the center and wall zones is essential for a full-spectrum understanding of emotionality, motivation, and locomotor function.

Explore high-resolution tracking solutions and open field platforms at

References

  • Prut, L., & Belzung, C. (2003). The open field as a paradigm to measure the effects of drugs on anxiety-like behaviors: a review. European Journal of Pharmacology, 463(1–3), 3–33.
  • Seibenhener, M. L., & Wooten, M. C. (2015). Use of the open field maze to measure locomotor and anxiety-like behavior in mice. Journal of Visualized Experiments, (96), e52434.
  • Crawley, J. N. (2007). What’s Wrong With My Mouse? Behavioral Phenotyping of Transgenic and Knockout Mice. Wiley-Liss.
  • Carola, V., D’Olimpio, F., Brunamonti, E., Mangia, F., & Renzi, P. (2002). Evaluation of the elevated plus-maze and open-field tests for the assessment of anxiety-related behavior in inbred mice. Behavioral Brain Research, 134(1–2), 49–57.

Written by researchers, for researchers — powered by Conduct Science.

Author:

Louise Corscadden, PhD

Dr Louise Corscadden acts as Conduct Science’s Director of Science and Development and Academic Technology Transfer. Her background is in genetics, microbiology, neuroscience, and climate chemistry.

Related Posts

Female scientist pointing at molecular diagram during lab presentation with text "Call for Papers" for ConductScience.

Get access to top-tier research from scientists publishing today.

50% OFF for new subscribers