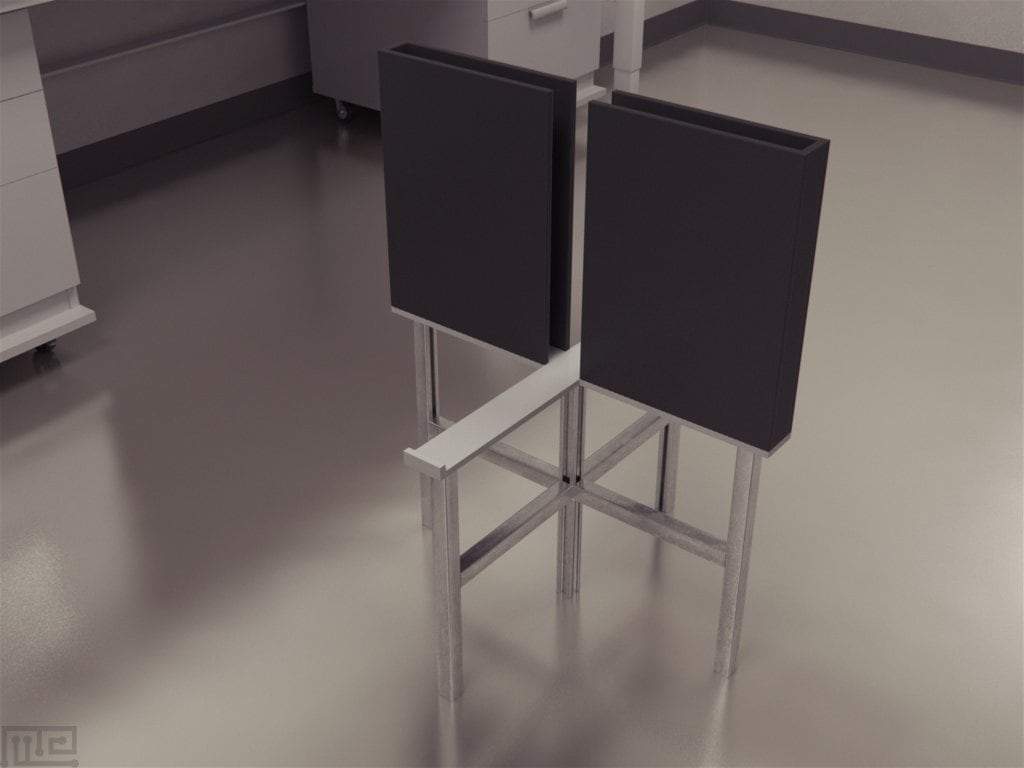
Specifications
| Mouse |
Rat |
| 35cm arm length - 5cm arm width - 20cm wall height - 61cm stand height |
50cm arm length - 10cm arm width - 30cm wall height - 61cm stand height |
| Acrylic |
Acrylic |
| No Odors |
No Odors |
| Matted for non reflective surfaces |
Matted for non reflective surfaces |
| Easy clean with 70% Ethanol |
Easy clean with 70% Ethanol |
Doors
Extra Wall Height
Extra Wall Height
Raised edge lip around open arms
-
Used for Mouse or Rat
-
Dimensions: N/A
- Cost $100
-
Used for Mouse
-
Dimensions: 40cm
- Cost $125 (Add $50 for Shipping)
-
Used for Rat
-
Dimensions: 50cm
- Cost $150 (Add $75 for Shipping)
-
Used for Mouse and Rat
-
Dimensions: 0.5cm or 1cm height, please specify, to fit
- Cost $75.00
See our FULL citation list
Click here
Modifications
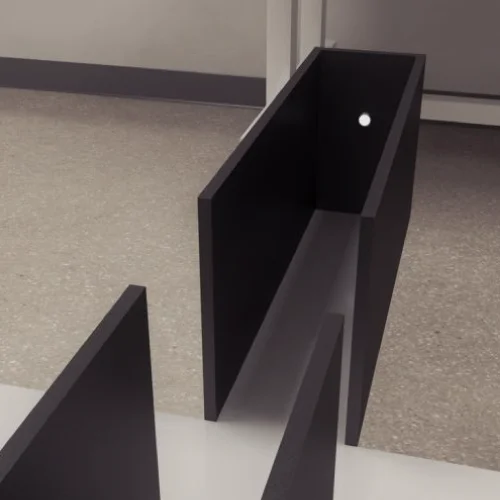
Light Cues
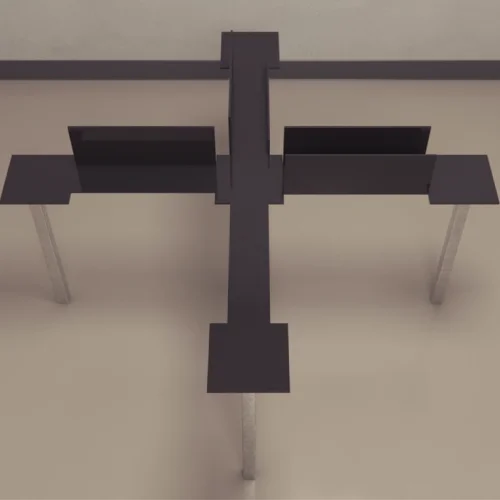
Asymmetric EPM
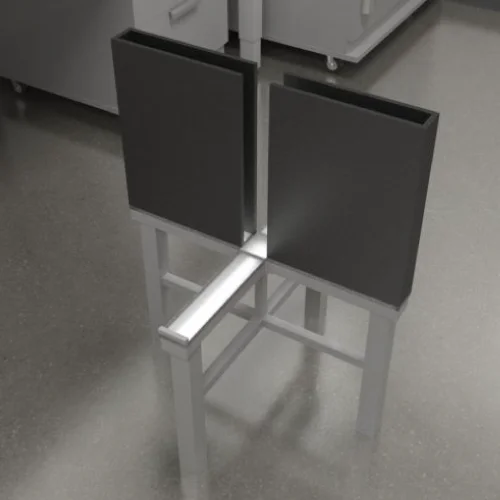
Backlights

Automated Elevated Plus Maze
Documentation
https://www.youtube.com/watch?v=Fn8WRyufcpI
Introduction
Elevated Plus Maze (EPM) is a widely used behavioral assay in the study of anxiety and anxiety-related disorders in neuroscience. The maze is based on the tendency of rodents to avoid exposed open areas and their innate behavior to scavenge for food. The EPM is a four-choice armed maze that exploits the natural tendency of rodents to seek sheltered spaces. Of the four arms of the maze, two arms are enclosed by walls while the remaining two are un-walled.
Observation of fear and anxiety-evoked behaviors in rodents was made by K. C. Montgomery in 1955 using an elevated Y-Maze (see also T-Maze) which had one of its choice-arm enclosed by walls and the other arm un-walled. These observations resulted in Handley and Mithani (1984) testing fear-motivated behaviors using an Elevated Plus Maze designed by them. Since its conception, the maze has been used for testing and validating the anxiety-inducing effects of research compounds. The Elevated Plus Maze is also used in understanding the underlying biology and mechanisms of anxiety-like behaviors.
The maze consists of four arms spaced at an angle of 90 degrees from one another. Alternating arms of the maze are enclosed to create a protected area while the open arms create an anxiogenic space. The concept of the Elevated Plus Maze has been adapted into other mazes such as the Elevated Zero Maze which uses a continuous circular path having some segments enclosed and open, and the Cross Maze which contains a clear enclosed central area with doors leading to each arm. Another variation of the EPM is the Elevated Asymmetric Plus Maze.
History
2.1 Origin
In 1955, Montgomery published a paper that correlated fear induction in novel spaces and exploratory behavior. He made use of an Elevated Y-Maze with one of the choice arms enclosed within walls and the other choice arm left open. He was able to observe that exploratory behavior gradually increased across trials in the elevated maze although the subjects showed a greater amount of avoidance behavior. These observations of fear-induced behavior and exploration were then adapted by Handley and Mithani in 1984 into an Elevated Plus Maze task.
In 1985, Pellow
et al. investigated the validity of the Elevated Plus Maze as a measure of anxiety in rats. They tested the apparatus for validation under three areas: physiological, molecular, and behavioral effects. Their investigation was successful in showing that the preference for closed spaces was in agreement with Montgomery’s result which suggested that aversion towards open arms was due to anxiety more so than fear.
2.2 Developments
The Elevated Plus Maze was seen as a useful tool in quantifying anxiety in rodent models and became one of the most widely used apparatuses in molecular testing (Pellow
et al., 1985; Lister
et al., 1987).
Gentsch
et al. (1987) compared the behavioral performances of the spontaneously hypersensitive rats (SHR) (widely used in animal models of hypertension in humans) and Wistar-Kyoto rats on an EPM and found a clear distinction in their fear responses to the open spaces of the maze. The Wistar-Kyoto rats showed a higher reaction to aversive environments than the SHR.
Brett and Pratt (1990) investigated the role of chronic handling of the subjects on the behavior of anti-anxiety therapy-treated animals in an Elevated Plus Maze. They proposed that, although the effect was negligible, the results coupled with other studies suggest that rats habituated to handling represent a ‘normal’ unstressed state. Another study speculated on the possible influence of gender and age on the performance of rats in the EPM. Imhof
et al. (1993) tested male and female Wistar rats of varying ages and found that within a certain range of age (60 and 120 days) significant sex-related differences could be observed.
2.3 Recent Developments
Akyazi
et al. (2104) investigated the transmission of stress between cage mates by grouping animals together that were stressed with unstressed animals. The transmission group that consisted of non-stressed transmission (TC) animals paired with the transmission group (TS) spent more time in open arms as compared to the non-stressed reference value group. The hypothesis of transmission of stress in cage mates was supported by the gradual decrease of stress hormone levels from the stress-exposed group (that served as stress control) towards the reference value group.
Colnaghi
et al. (2016
) proposed that the absence or presence of social involvement could plausibly play a significant role in how adverse experiences are encoded. The performance of mice was examined in an Elevated Plus Maze task by placing groups rather than individuals on the maze. It was observed that social involvement led to increased time spent in the open arms of the maze.
Apparatus & Equipment
The Elevated Plus Maze has a small central platform with four arms radiating outwards. The arms are placed at an angle of 90 degrees from each other and are usually 30 to 50 cm in length and about 5 to 10 cm in width. The dimensions of the apparatus can vary depending on the subjects used (whether mice, rats or small primates). Alternating arms are enclosed by high walls of t usually with an open roof. These walls are either opaque or transparent. For the un-walled arms, an end plate and raised edges ensure that the subject does not fall off the open arm while exploring. The apparatus floor should be in contrast with the color of the subject being tested. The entire apparatus is raised above the ground to a height of at least 50 cm.
To avoid shadows in the maze, the Elevated Plus Maze should be well-lit from above. Proper lighting also ensures that the subject can see the food rewards or other cues. Tracking software and video camera, such as Noldus Ethovision XT or ANY-Maze mounted above the maze can assist with the live scoring and tracking and recording of the subject and its movements within the maze. The apparatus must be cleaned thoroughly before and after each trial to limit the influence of any residual stimuli from previous trials.
Training Protocol
The Elevated Plus Maze is employed in the assessment of anxiety and anxiety-related disorders. The subject’s preference for open spaces is observed under this test, and the performances of the treated group or the disease group are compared with that of the control group. Rodents have an innate preference for closed or enclosed spaces where they feel safe. Thus they tend to avoid exploring exposed arms as much as the enclosed ones.
Animals treated with anti-anxiety therapies show reduced anxiety-like behavior and are more likely to explore the exposed arms of the maze. On the other hand, animals treated with anxiety-inducing compounds will spend less time in open spaces and more time exploring the enclosed arms due to the heightened anxiety-like feeling. The amount of time the animal spends on either of the arms provides information regarding the anxious state of the subject.
The maze requires no pre-training or repeated trials as the task is intended to test the response of the subject to an unfamiliar maze. Before every trial, the apparatus must be thoroughly cleaned to avoid the influence of residual stimuli if any.
Evaluation of Anxiety State Using the Elevated Plus Maze
To ensure accurate results, the trials are carried out in an exact manner for each test subject. The test subject is brought into the test room in its individual home cage to avoid any unnecessary stress and is allowed to acclimate (if required). The subject is then placed on the central platform facing the open arm away from the experimenter. It is important to ensure that all the test subjects face the same arm in the preceding trials.
The experiment begins as soon as the animal is placed on the central platform. The subject is allowed to explore the maze for a set period of at least 5 minutes, and its behavior is recorded via a ceiling-mounted video camera. Data is collected for the number of arm entries into the open and closed arm, and for the time spent in each arm. Arm entries are recorded only when the subject places all four of its paws within the arms. Any anomalies such as freezing or immobility and falling of the apparatus are also recorded.
When the set time has elapsed the subject is removed from the maze and placed back into its home cage (Komada
et al., 2008).
Modifications
The Elevated Plus Maze has seen several adaptations since its original design to meet the requirements of different investigations. The maze was often used by pre-training the subjects and testing them more than once over a period of time. However, it was observed that pre-training and repeated trials with the same subject resulted in test decay and altered behavior such as decreased activity on the open arms. The maze is now used without pre-exposure to achieve optimum results and to avoid these effects (Walf & Frye, 2007, Campos
et al.,. 2013).
The maze can also be automated to include doors to the arms to isolate the arms. Another modification could be done by enclosing the adjacent arms instead of alternating the enclosed arms. This adaptation is used in a discriminative avoidance task to investigate the interactions between aversive memory and anxiety responses in rodents (Leão
et al., 2016). The enclosed arms can also be modified to include aversive stimuli such as bright lights and loud sounds to achieve a variation in anxiety investigation (Silva
et al., 1997).
The Elevated Zero Maze uses the same concept as the Elevated Plus Maze but eliminates the need for a central platform by using a continuous circular path that has some segments enclosed and some exposed. Another variation of the EPM is the Cross Maze. This maze uses a clear enclosed central platform with doors leading to identical exposed arms.
The Elevated Asymmetric Plus Maze was first described by Ruarte
et al. in their 1997 paper. The design of the asymmetric EPM was intended to create conflictive exploration among the subjects. The basis of the approach was that novel environments with fear-inducing characteristics induce specific behaviors and modulate exploration by fear.
The Elevated Plus Maze serves as a simple and effective tool not just for the assessment of anxiety and anxiety-related disorders, but also for understanding learning and memory-related deficits associated with lesion-induced, genetic or age-related disorders.
Data Analysis
Data collection from the Elevated Plus Maze is straightforward. The data is collected for the number of open-arm entries, the number of closed-arm entries, time spent in open arms and time spent in closed arms. Apart from these data, latencies to enter/ exit from the arms can also be collected along with other anxiety-related measures such as the number of head dips and grooming.
These data can be visualized by graphing the individual measures and then comparing them across control and treatment groups of animals. Animals treated with anxiety-reducing therapies are more likely to spend time in the open areas than the control animals.
Graphs allow easy visualization and comparisons across treatments and control groups. Anxiety-inducing substances heighten anxiety-like behaviors while anxiety-reducing therapies decrease such behaviors, which can be observed during the Elevated Plus Maze task. Generally, cohorts of approximately 20 animals per group are sufficient to obtain p-values of <0.05 using ANOVA (Vorhees
et al., 2011, Walf & Frye 2007).
Strengths & Limitations
The Elevated Plus Maze is a popular behavioral assay for anxiety-related behaviors. Animal models have often served as a tool for understanding the human implication of treatments and for creating a controlled environment for the investigation of human diseases and disorders..
The Elevated Plus Maze has also seen a virtual adaptation of the task for humans. Virtual reality enables the creation of ecologically and ethologically valid environments. The Virtual Elevated Plus Maze is often combined with a real-world maze to create a mixed-reality environment to investigate human fear-avoidance behaviors. Using a virtual environment is cost-effective and does not endanger the subjects. Since the maze environments are virtual, the possibility of creating environments to suit the needs of any investigation is endless.
The Elevated Plus Maze can be easily adapted for testing of behaviors apart from those related to anxiety such as memory and cognition.
Summary and Keypoints
- The Elevated Plus Maze is a widely used anxiety-related behavioral assay.
- The maze has four alternating enclosed and open arms radiating from the small central platform, spaced at 90 degrees from one another.
- The animal’s preference for enclosed or open spaces is recorded in an Elevated Plus Maze task.
- Subjects treated with therapies tend to show lessened anxiety-like behavior by visiting the open arms more.
- Subjects treated with anxiety-inducing substances show heightened anxiety-like behavior and prefer the enclosed areas of the maze.
- By enclosing the adjacent arms and introducing aversive stimuli in the enclosed arms, the apparatus can be easily adapted for a discriminative avoidance task.
- Specific strains of rodents may perform differently on the maze.
Mouse
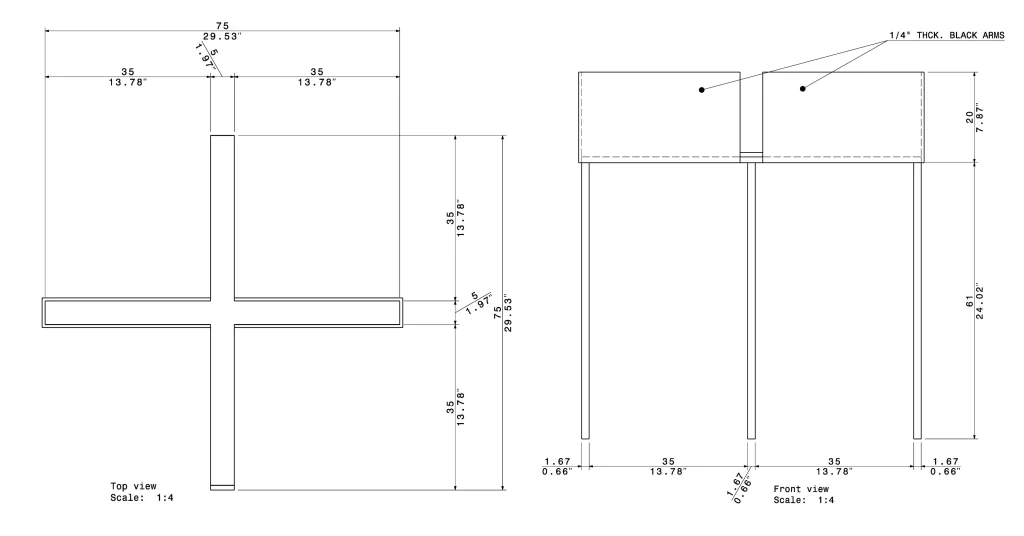
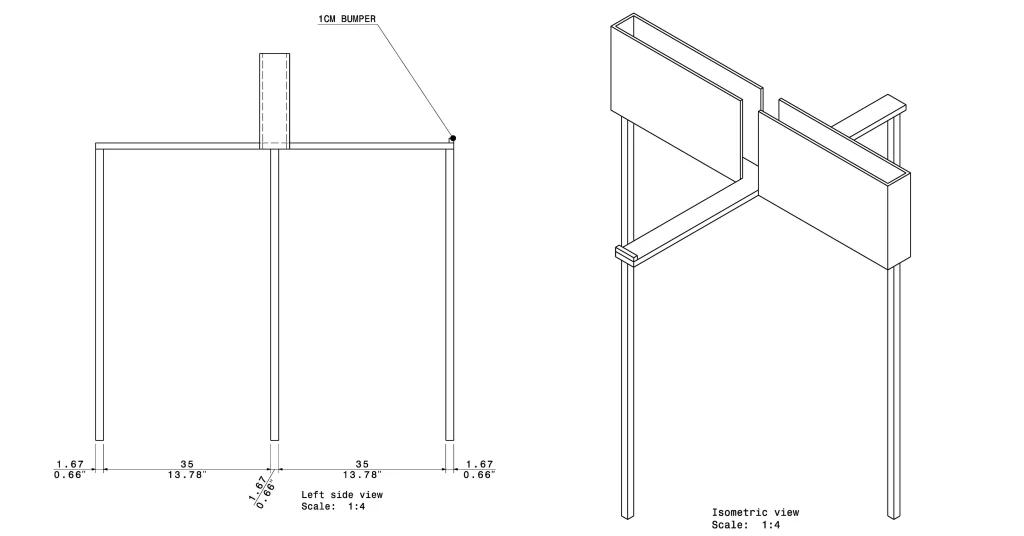
Mouse Elevated Plus Maze Size (CM)
- Arm Length: 35cm
- Arm Width: 5cm
- Wall Height: 20cm
- Stand Height: 61cm
- Edge Bumper: 1cm
Rat
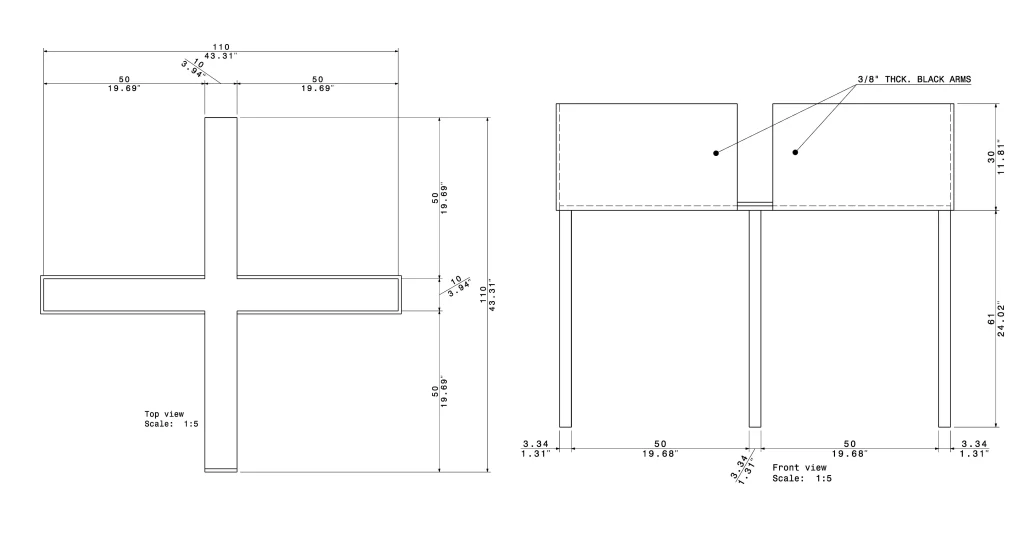
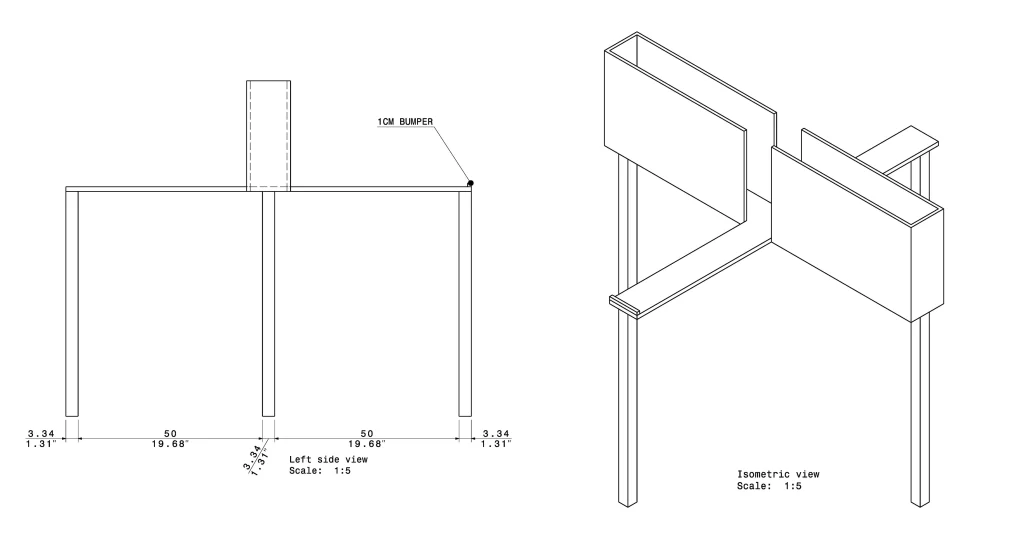
Rat Elevated Plus Maze Size (CM)
- Arm Length: 50cm
- Arm Width: 10cm
- Wall Height: 30cm
- Stand Height: 61cm
- Edge Bumper: 1cm
How to assemble the Elevated Plus Maze?
- Connect leg connectors to legs by pushing leg connectors into T slots in the configuration seen in the below images.
- Screw mounting plates into the top of each leg
- Place floors on top of mounting plates
- Pace walls on the sides of each wall
- Place end walls at the end of each floor
