
Fluorescence spectrophotometry is a set of techniques that deals with the measurement of fluorescence emitted by substances when exposed to ultraviolet, visible, or other electromagnetic radiation.
It has wide application in chemical and biological sciences as it can be used to analyze a biological system, by studying its interactions with fluorescent probe molecules (So and Dong, 2002, The International Pharmacopoeia, 2019).
In the literature, the terms fluorescence spectrophotometry, fluorescence spectroscopy, fluorometry, and spectrofluorometry are often used interchangeably.
Fluorescence spectrophotometry is based on fluorescence, which is a photoluminescence event (photo = light; luminescence = the emission of light). In simple terms, it is the emission of light because of exposure to (and resultant absorption of) light.
Here, this exposure to and absorption of light is called excitation. A common form in which photoluminescence is often observed, is as phosphorescence – what you see in glow-in-the-dark toys.
This type of photoluminescence occurs when there is a long delay between the excitation and emission of light.
A long delay here means about 10-6 seconds or longer. When the delay between excitation and emission is shorter (between 10-6 and 10-8 seconds), the result is fluorescence (Wouterlood and Boekel, 2009).
Phosphorescence can persist long after the initial exposure to light – hence you may see the glow-in-the-dark star against your bedroom ceiling even after the room had been dark for hours.
Fluorescence, on the other hand, has a quick flash of emission (typically around 10 nanoseconds, but sometimes shorter than 1 nanosecond). Because of this, sophisticated electronics and optics are nowadays used to detect and measure fluorescence (Lakowicz, 2013).
The first observation and description of fluorescence, however, was done with little more than a glass of tonic water, sunlight, and the human eye. The human whose eye that was, is Sir John Frederick William Herschel (1792 – 1871).
In 1845, he reported on this phenomenon. He mixed equal amounts of quinine and tartaric acid in water, diluted it, poured it into a glass cylinder, and looked at it from all angles, where it stood by a window in bright sunlight.
What he saw was “an extremely vivid and beautiful celestial blue color” (Herschel, 1845). The celestial blue color came from the aromatic organic molecule (or fluorophore), quinine, present in tonic water.
The physics behind fluorescence involves the different electronic and vibrational states that fluorophores can exist in. An electronic state is divided into multiple vibrational states.
Photons, that have energies in the ultraviolet to a blue-green range of the spectrum can trigger an electronic transition from the lowest vibration in the ground state to one of the vibrational levels in a higher electronic excited state (So and Dong, 2002).
As soon as the energy input from the photon (in other words the excitation) stops, the fluorophore molecule relaxes into the lowest vibrational level of the excited electronic state.
The fluorophore remains in this state for some time (around 10 nanoseconds, known as the fluorescence lifetime) and then returns to the electronic ground state. This return to the ground state is associated with a release of energy, known as fluorescence emission (So and Dong, 2002).
The number of photons emitted by a fluorophore, relative to the number of photons absorbed, is called the quantum yield. A fluorophore with a large quantum yield, like rhodamine, will display a bright emission.
The emitted radiation is always of a longer wavelength (lower energy) than the excitation radiation (higher energy). For example, if the incoming light was blue (shorter wavelength), then the appropriate fluorophore will emit green light (longer wavelength).
This observation, which was first described by Sir George Gabriel Stokes, and therefore today called the Stokes shift, is caused by the rapid return of the excited molecule to its ground state (Lakowicz, 2013, Wouterlood and Boekel, 2009).
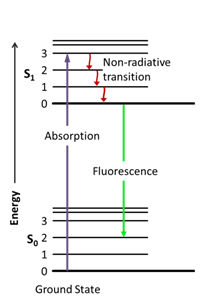
The process that happens between excitation and emission is illustrated using Jablonski diagrams (named after the father of fluorescence spectroscopy, Alexander Jablonski) (Lakowicz, 2013). These diagrams, such as the one in figure 1, show the different electronic (S0 and S1) and vibrational (0,1,2,3) states of a molecule.

Figure 1. Jablonski diagram (Jacobkhed, 2002 [CC0 1.0])
Intrinsic fluorophores are molecules with a natural fluorescence, such as chlorophyll and aromatic amino acids.
Extrinsic fluorophores are those that are added to a sample to provide fluorescence, or to change the spectral properties of the sample. Examples of extrinsic fluorophores are fluorescein and rhodamine, but there are many more (Lakowicz, 2013).
Each fluorophore has its own characteristic properties, such as fluorescence lifetime, intensity, and position of the emission wavelength, thus, each fluorophore will yield a unique fluorescence spectrum. A fluorescence spectrum is a plot of the fluorescence intensity as a function of wavelength (Albani, 2007).
The environment in which the fluorophore finds itself will influence and modify its properties, hence reading the fluorescence spectrum of a fluorophore when immersed in different environments will give information about those environments (Albani, 2007, Lakowicz, 2013).
For example, the intrinsic fluorophore tryptophan is an aromatic amino acid that is very sensitive to its local environment within the cell. When a ligand binds to it, or when it associates with a protein, or when a protein unfolds, tryptophan’s fluorescence spectrum will change in particular ways.
By monitoring this change in the spectrum, one can deduce information about the immediate cellular and molecular environment.
In this way fluorophores, when linked to peptides, proteins, membranes, or DNA, can be used to study the structure, dynamics, and metabolism of living cells (Albani, 2007).
While some fluorescence can be detected with the eye, sophisticated instruments have been built to detect even the faintest fluorescence emitted by a molecule.
An older type of instrument for the measurement of fluorescence spectra, and one that is still used today, is the filter fluorometer. It consists of the following parts:
The filters only permit radiation of certain wavelengths (typically the primary filter permits short wavelengths needed for excitation and the secondary filter permits long wavelengths associated with emission) and serves to eliminate residual radiation scatter.
The fluorescence detection system consists of photomultiplier tubes (PMT) that amplify the photon emission and record and display the signal electronically (Albani, 2007, Sharma and Shulman, 1999, The International Pharmacopoeia, 2019).
Most modern fluorescence spectrophotometers (also called spectrofluorometers) are more advanced instruments than the filter fluorometer in that they can detect fluorescence with higher precision and extraordinary sensitivity.
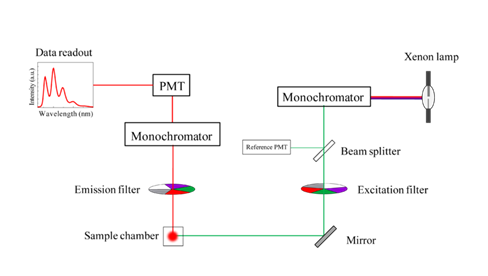
They are superior in wavelength selectivity, flexibility, and convenience. A spectrofluorometer (see figure 2) is often equipped with the following:
The high-pressure xenon arc lamp, used as the excitation source, can provide an energy continuum that extends from the ultraviolet into the infrared (The International Pharmacopoeia, 2019).
Instead of filters, spectrofluorometers have monochromators that allow for the production of individual wavelengths from a broad-band light source (Sharma and Shulman, 1999). This makes it possible for spectrofluorometers to record both excitation and emission spectra (Lakowicz, 2013).
The monochromators allow one to keep emission fixed at a single wavelength to obtain the excitation spectrum. Vice versa, it is possible to keep excitation fixed at a single wavelength, to record the fluorescence emission spectrum (Albani, 2007, Lakowicz, 2013).
Like the fluorometer, the spectrofluorometer’s fluorescence detection system consists of photomultiplier tubes (PMT) for emission amplification. Electronic devices are then used to quantify the signal and display it electronically, usually as a graph (Lakowicz, 2013).

Figure 2. Schematic diagram of a spectrofluorometer (Sobarwiki, 2013 [Public domain])
Fluorescent measurements can be classified into:
In steady-state measurements, a sample is illuminated with a continuous beam of light and the fluorescence intensity of fluorescence emission spectrum is recorded.
In time-resolved measurements, a sample is illuminated by a short pulse of light after which the intensity decay or anisotropy decay is measured. (Lakowicz, 2013). Intensity decay refers to the fluorescence lifetime or the time that a molecule spends in the excited electronic state.
How long the molecule’s fluorescence lifetime is can provide rich information about the environment surrounding the fluorophore (Sharma and Shulman, 1999).
From the basic technology of fluorescence detection, as outlined above, a plethora of fluorescence technologies have evolved, such as multiphoton excitation, fluorescence correlation spectroscopy, single-molecule detection, fluorescence immunoassay, flow cytometry, and near-infrared fluorescence spectroscopy (Lakowicz, 2013, Sharma and Shulman, 1999).
The applications of fluorescence spectroscopy are almost as wide as one’s imagination. It is hard to imagine the chemical and biological sciences without this technique nowadays.
Only selected examples of application per sector, for some of the most common sectors it is used in, will be mentioned in the quick overview that follows.
In biosciences, one of the most frequent applications of fluorescence spectroscopy is the high precision quantification of DNA and RNA. An extrinsic fluorophore (often ethidium bromide) is added to a DNA sample and the sample is loaded into a fluorescence spectrometer to obtain a reading of the sample’s concentration.
Another modern application is SMRT (single molecule real-time) DNA sequencing. In its ability to produce long-read single molecules with high accuracy, it is predicted to be central to the next genetic diagnostic revolution (Ardui et al, 2018).
Fluorescence spectroscopy is used in several industrial settings as a fast, non-invasive technique in the assessment of contamination (Kohli, 2012). For example, it has been used to detect contaminating organic compounds in groundwater, after hydraulic fracturing for gas exploration (Dahm et al., 2011).
An important chemical application of fluorescence spectroscopy can be found in the field of nanoparticle synthesis for potential medical uses, such as drug delivery.
When nanoparticles are exposed to biological fluids, they become coated with proteins and other biomolecules (called the protein corona). The interactions between the nanoparticle and the protein corona have implications for its safe use in vivo.
Time-resolved fluorescence quenching and fluorescence correlation spectroscopy are used to study these interactions and understand nanotechnology better (Röcker et al., 2009).
In environmental monitoring, the technique also has wide application. One example is in the treatment of water surrounding landfill areas.
As rainwater percolates through waste and liquid forms during the biodegradation of waste in a landfill, landfill leachates form. Leachate contains a mix of pollutants that can be harmful to the environment.
High-resolution fluorescence spectroscopy and 3D-excitation emission matrix fluorescence spectroscopy are used to characterize dissolved organic matter in these samples and then based on that, optimize treatment processes for landfill leachate (Leenheer and Croué, 2003, Zhang et al., 2013).
Spectrofluorometric techniques are also used in the pharmaceutical field to analyze drugs. An example is the analysis of co-formulated tablets prescribed as cholesterol medication.
Synchronous fluorescence spectroscopy provides a simple, fast, and accurate method for analyzing a tablet called Atoreza©, which contains both Ezetimibe and Atorvastatin calcium. The method is ideal for routine quality control of this medication (Ayad and Magdy, 2015).
In agriculture, spectroscopic techniques are also widely applied for instance in the identification of different crop varieties. The laser-induced fluorescent emission technique (LIFS) is an excellent tool used to identify citrus seedling varieties (Milori et al., 2013).
Likewise, total luminescence spectroscopy can be used by tea manufacturers as a quick, affordable, and objective alternative to employing trained tea tasters, to discriminate between similar types of tea (Seetohul et al., 2013).
As fluorescence spectrophotometry spans a history of nearly 70 years, it has evolved into a technique with numerous sophisticated uses.
Any particular situation where it can be applied thus warrants careful research into the most suitable way in which it can be used to obtain the needed outcomes.
Fortunately, a wealth of literature and commercial options are available for scientists wanting to explore fluorescence spectrophotometry in greater depth.
