
The optical or light microscope is very well-suited for the imaging of biological specimens, for three main reasons:
This article will focus on the third point, describing three very different optical microscopy techniques that have been developed for the analysis of biological specimens, as examples of their versatility. It is a companion article to “The Light Microscope.”
One of the most powerful advances in the life sciences was the development of fluorescently labeled proteins and small molecules, which has allowed the visualization of molecular-scale biological processes.
One example of this is the discovery that a subsection of the enzyme ATP synthase exhibits rotational motion, acting as a molecular machine.[1]
This was studied by immobilizing the subsection, and selectively attaching to it a fluorescently labeled protein. When exposed to ATP, the long proteins could be seen to rotate in high-speed video recordings.
Even more sophisticated fluorescence microscopy techniques can be used to perform so-called “super-resolution” microscopy, in which structures below the normal resolution of the optical microscope (~ 0.2 microns) can be visualized.[2]
These techniques rely on selectively detecting only a subset of fluorescently activated molecules at one time, then averaging across many measurements.
The optical microscope is a key tool in histopathology, which is the analysis of gross tissue samples to diagnose diseases. In traditional methods, the tissue being analyzed is physically sectioned, or cut into thin sheets, prior to microscopy.
This involves either freezing the specimen, or encasing and infiltrating it with a liquid that can later be solidified (“paraffin sectioning”).[3] This type of analysis is used to diagnose cancers and other diseases using biopsies or tissues removed during surgery, in neuropathology, and in determining the cause of death.
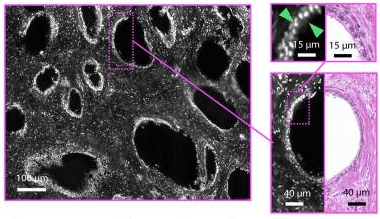
More recent advances in fluorescence microscopy, however, have also resulted in techniques where sections of a tissue sample can be visualized without physically cutting them. An example of such a technique involves fluorescently labeling the tissue, then selectively illuminating it with a sheet of light.[4]

Figure 1: Simulated sections of a prostate gland using fluorescent tagging and illumination with a light sheet (grayscale), compared to a physically sectioned and stained specimen (pink).[4]
When combined with automated image analysis, the optical microscope can be used as a quantitative tool. Probably the best known example of image analysis software that can be paired with optical microscopy (as well as other types of microscopy) is ImageJ, formerly known as NIH Image.[5]
Quantitative image analysis in biology can take many forms. A simple example is applying a pixel brightness threshold to an image containing light colored particles to distinguish the particles from the background.
After thresholding, software can be used to count and size the particles. A more complex and sensitive use of image analysis is in “computer-assisted diagnosis”, where image analysis is used to assist pathologists in diagnosing diseases.
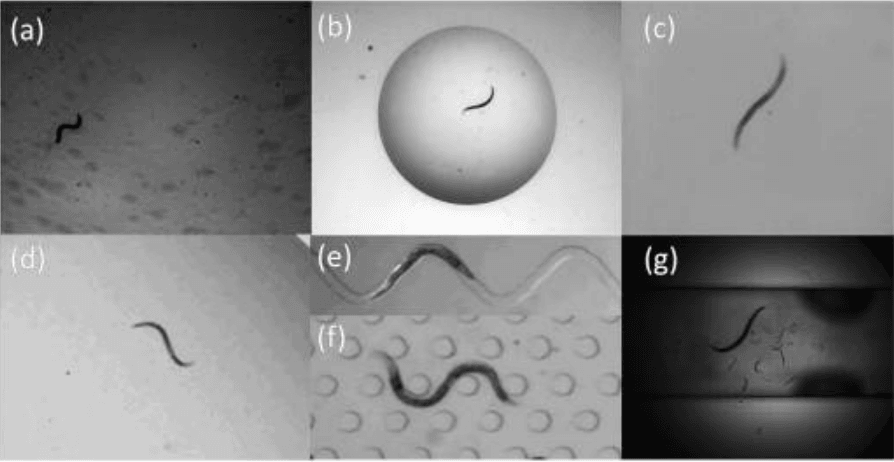
Software can even be trained to detect subtle aspects of an organism. An example of this is an image analysis method that is capable of detecting and classifying the motility of nematode C. elegans in a variety of environments, including swimming in liquid and crawling on dry surfaces.[6]
C. elegans is used as a model organism in a range of studies, and being able to automate this type of analysis is a powerful aid to these studies.

Like image analysis, three-dimensional imaging using light microscopy can take many forms. One modern technique that produces striking and scientifically useful images is laser scanning confocal microscopy, which can also be combined with fluorescence techniques.
In this method, a special set of optics is used so that light is collected from only a small, well-defined point in the specimen. This point can then be scanned in two dimensions to capture a ‘slice’ of the specimen, or in three dimensions to collect a full 3D image.
Another example of the use of three-dimensional imaging is the simple use of scanning in the z direction (i.e. focusing and defocusing) to measure the thickness of a transparent biofilm.[7]
Here, the z-stage height difference between where the top and bottom surfaces are in focus is measured, then corrected by the refractive index, to measure the physical thickness of the biofilm.
This is a simple and inexpensive technique compared to measuring the thickness in other ways, for example cross-sectioning for electron microscopy.
Optical microscopy is a highly versatile technique, which makes it a good match for the diverse types of analysis required to study biological systems. This article has only given a handful of examples of the many potential uses for optical microscopy in the life sciences lab.
