x
[quotes_form]
culture media

Basic Microbiology Techniques

Are you looking for Laboratory Devices for your lab?

Overview

There are several microbiology techniques and procedures specially developed over the years to study and understand the metabolic processes, genetics, functions, and interaction of microbes with other organisms.[1]

The methodologies mostly involve techniques for culturing, identification, isolation, staining, and engineering these tiny organisms. They also have applications in other areas of biological research, including genetics, plant physiology, evolution, and molecular biology.[1]

Moreover, some of them contribute to better our health, but some cause life-threatening diseases. Others are used in food and beverage production, and to understand all this, we need to study these organisms.

Given the myriad uses of microbiology and its basic techniques, this article presents an overview of the basic microbiological laboratory techniques, how they work and are used in labs.

Categories of Basic Microbiology Techniques

The microbiology techniques are categorized based on the type of experiments. It includes:[2]

  • Culturing and Aseptic Techniques
  • Bacteria enumeration
  • Identification of Pathogens

These techniques don’t cover every microbiology technique; however, they are fundamental to all practices performed in microbiology laboratories.

1. Aseptic Techniques

Microorganisms are everywhere, and to study specific organisms, it’s essential to grow them in a strictly controlled lab environment. A complete sterile condition protects the pure microbial culture from contamination by other organisms entering through the air, water, or other unsterile sources.[2]

Some techniques used in labs to maintain a completely aseptic environment include:[2]

A. Sterilization

It’s the complete removal of all other microbial forms, including viruses, bacteria, fungus, spores, and other vegetative cells from the surface or the culture media.

Based on the purpose of the sterilization, the method is categorized into two groups:

  • Physical Methods: It involves the killing of contaminants or microbial forms using heat, sunlight, drying, filtration, or irradiation techniques (e.g., UV, infrared, gamma radiation, and X-ray).
  • Chemical Methods: It utilizes chemicals such as phenol (and any other related compounds), dyes, soaps, detergents, alcohol, gaseous compounds, and heavy metals and their compounds to destroy microorganisms.[2]

B. Disinfection

Disinfection is the process of killing microbes or inhibiting their growth from inanimate objects or surfaces by using physical or chemical agents like phenol, chlorine, alcohol, and heavy metal and their compounds.[2]

C. Sanitization

It’s the complete elimination of all pathogenic and non-pathogenic microbes from surface tops to reduce contamination. It’s also employed in daily lives to sanitize hands or in restaurants, dairies, and breweries to remove microbes and prevent infection and contamination.

It involves using chlorine-based cleaners, alcohol-based cleaners, formaldehyde, and hydrogen peroxide.[2]

2. Culturing Techniques

Before introducing the microbial strain to the culture media, the isolation and inoculation techniques are followed.[3]

A. Inoculation

It’s a basic technique used in microbiology labs to place microbial cultures onto a culture medium. It’s performed using an apparatus, called inoculation loop, made of platinum or nichrome wire with a loop at its one end. It’s mainly used in streaking and culture plate techniques.[3] The small sample picked up and transferred from the culture is known as inoculum.

B. Isolation

Isolation is a microbiological technique in which a specific microbial strain is isolated from a mixed culture of microorganisms by culturing the microbes on a selective culture media.[3] However, the procedure must be repeated several times to eliminate contamination by other microbes and achieve a pure culture of the microbial strain, which is then observed in culture plates as discrete/isolated individual colonies.

C. Culturing techniques

Microbes are grown in labs on culture media, which supply their nutritional requirements. These requirements vary for different microorganisms, thus a spectrum of culture medium recipes have been developed by scientists to obtain the desired microbial strain.[3]

  • Simple or basal media: It consists of sodium chloride, peptone, meat extracts, and water, for example, Nutrient Broth.
  • Complex media: This contains an additional special ingredient that helps to enhance a special characteristic or provide nutrients for the growth of certain microbes. It may contain extracts from plants, animals, and yeast, such as blood, yeast extracts, serum, milk, meat extracts, soybean digests, and peptone.[4]
  • Synthetic or defined media: It’s used for research purposes. They are prepared by following an exact formula and mixing distilled water with specific amounts of inorganic and organic chemicals.[4]
  • Special media: The basic medium supports the growth of a broad spectrum of microbial forms. However, a special growth condition is required for the culture and isolation of only a certain type or selected strain of bacteria. These formulated media to grow a microorganism chosen are known as special media. It’s further categorized into different groups:[5]
    • Selective media: It inhibits the growth of selected microorganisms while allowing the other to flourish. Examples include desoxycholate citrate medium for dysentery bacilli or mannitol salt agar containing 7.5% NaCl for Staphylococcus.
    • Enriched media: It contains complex organic substances like hemoglobin, serum, blood, or growth factors to support the growth of certain microbes. Examples are blood agar (widely used to grow certain streptococci and other pathogens) and chocolate agar.
    • Indicator media: It contains an indicator that changes color when a certain bacterium grows on the medium. For example, the addition of sulfite in the Wilson and Blair medium changes color to black when Salmonella typhi colonies grow on the medium.
    • Differential media: This media allows the growth of different bacterial species and distinguishes them based on their size, shape, color, or formation of gas bubbles or precipitates in the medium. Examples are MacConkey medium and blood agar.
    • Transport media: It’s a buffer solution containing peptone, carbohydrates, and other nutrients (except growth factors) to maintain the viability of the bacteria during transport without allowing their multiplication. An example is the Stuart medium for gonococci.
    • Anaerobic media: It contains ingredients that support the growth of anaerobic bacteria. An example is Robertson’s cooked meat media.

Now, the common culture techniques used in microbiology labs include:[5]

Common culture techniques
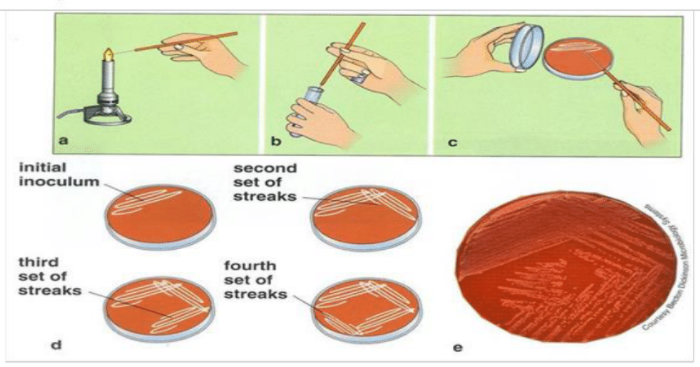
  • Streak plate method: In this technique, an inoculation loop is dipped in a diluted microorganism suspension and streaked on the solid surface of the culture medium. The plate which gets streaked is known as the streak plate. The method is generally used to obtain individual bacteria colonies from a concentrated suspension or to prepare a pure culture of a bacterial strain.
Streak plate technique illustration
Figure: An illustration of streak plate technique.[5]
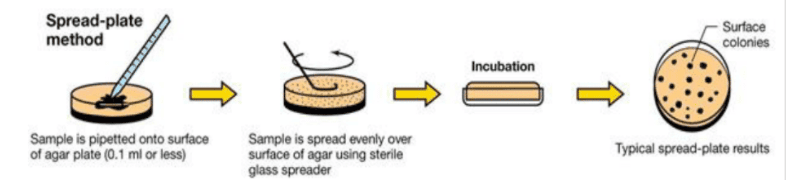
  • Spread plate method: In this method, a very small volume of the liquid suspension of the microorganism is poured on the solidified surface of the media-containing plate. Then, an L-shaped glass rod is used to spread the liquid evenly all over the plate surface. This is performed to obtain individual colonies of the microorganisms but can also count the number of the microbial population.
Spread plate technique illustration
Figure: An illustration of the spread plate technique.[5]
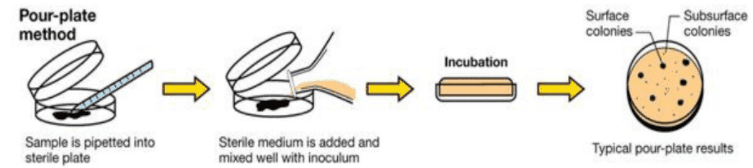
  • Pour plate method: In this technique, a serially diluted microorganism suspension is pipetted in a sterile Petri dish. Then, a liquified, cooled culture media is poured into the plate. After the media is solidified, the culture plate is incubated for specific bacterial growth. It’s performed to estimate the viable bacterial count in a microbial suspension.
Pour plate technique illustration
Figure: An illustration of the pour plate method.[5]

D. Incubation

After the microorganisms are inoculated in plates, the culture plates are sealed from base to lid using adhesive tape to prevent contamination. Then, the plates are kept in the incubator for the required time and temperature for the growth of the organisms. Furthermore, keeping the plates in an inverted position prevents the formation and fall of water droplets into the culture media.[4]

If it’s required to store the microbial samples for later experiments, the following storage techniques are used:

  • Refrigeration
  • Deep freezing
  • Lyophilization
  • Freezing in liquid nitrogen

3. Bacteria Enumeration

Counting microbial colonies is an essential task in performing a range of experiments. Here are some enumerating techniques:[6]

  • Serial dilution: It’s used to lower the concentration of bacteria to a required amount for the purpose of experimentation to culturing processes.[5] It helps to count the number of microbial populations and perform experiments with the necessary number of microbial populations.
  • Plate counts: By applying the plate count method, it is possible to determine how many microbial colonies could potentially emerge under the given physical and chemical conditions, such as pH, temperature, available nutrients, and growth inhibitory compounds.[6]
  • Most probable number (MPN): In this statistical technique, a broth is inoculated in a 10-fold dilution, predicting the number of viable microorganisms per volume in a given sample.[6]
  • Using spectrophotometer: A spectrophotometer is used to estimate the growth of microorganisms in the culture with respect to time or at a certain time.

4. Identification of Pathogen

Pathogen identification is important for several applications. For example, it’s used to know which microbe is involved in contamination and food spoilage, which has useful applications in human lives, and which microorganism caused the particular disease for correct diagnosis and treatment in hospitals.

Microbes are identified by:[5]

  • Morphology: This is the first step in the identification process where the microorganisms are assessed with the naked eye based on colony texture, shape, and size.
  • Staining techniques: The identification is done by staining microbes with certain chemicals and observing them under a microscope to assess their cell properties.[5]
    • Simple staining: In this method, bacteria are stained using a single reagent and identified based on their size, shape, and arrangement of cells.
    • Differential staining: Here, at least three chemical reagents are used to stain bacteria, and identification is done based on the color the microorganism shows.
    • Gram staining: Here, certain chemical reagents are used to differentiate two principal groups of bacteria, gram-positive and gram-negative.
  • Microscopy techniques: Some microorganisms like viruses can not be identified using a simple microscope, as in the case of other microorganisms. Therefore, a high-throughput electron microscope is required to identify them.
  • Biochemical tests: Different tests, such as oxidase test, catalase test, indole test, and Dnase test are performed to differentiate microorganisms based on their enzymatic activities.[5]
  • Motility: The motility capacity of microorganisms is assessed to distinguish them from other microorganisms and identify their groups.
  • Microbial serology: It’s a test performed by using methods like Enzyme-linked immunosorbent assays (ELISA), western blotting, agglutination, and direct and indirect immunofluorescence to determine the bacterial or viral antibodies and antigens.[5]
  • Molecular analysis: A spectrum of techniques including plasmid profile analysis, random amplified polymorphism deoxyribonucleic acid (RAPD), pulsed-field gel electrophoresis (PFGE), multiplex polymerase chain reaction, and deoxyribonucleic acid (DNA) sequencing are used to identify, characterize, and classify microorganisms.[5]

Conclusion

Microbiology techniques are required to study microorganisms’ structure, function, metabolism, and genomics. They help understand how microbes work, interact with living organisms, cause diseases, and how they can be applied for human use.

The fundamental microbiology laboratory techniques include aseptic techniques, culturing techniques, enumerating bacteria, and identifying different classes of microorganisms. These techniques form the base of advanced research and experiments performed on microorganisms. The data obtained through these experiments also relate to other branches of biology, including molecular biology, soil science, agriculture, and the evolution of organisms.

The microbial study has helped scientists in many ways, from understanding how life began on earth to the use of microbes to control pollution. Moreover, the efficient use of these microbiological tools provides a deeper understanding of microbial life and the discovery of new species with new mysteries.

References

  1. Basic Techniques of Microbiology. Retrieved from https://labmonk.com/blog/basic-techniques-of-microbiology/
  2. Basic Microbiology Laboratory Techniques. Retrieved from http://www.biocourseware.com/iphone/vml/bmlt/index.html
  3. Microbiology Techniques: Applications And Uses. Retrieved from https://microbiologyclass.com/microbiology-techniques-applications-and-uses/
  4. Microbiological Laboratory Techniques. Retrieved from https://clinicalgate.com/microbiological-laboratory-techniques/#
  5. Varghese, Naveena & Joy, P.P.. (2014). Microbiology Laboratory Manual.
  6. What are the key activities in a Microbiology laboratory? Retrieved from https://lab-training.com/what-are-the-key-activities-in-a-microbiology-laboratory/

Learn More about our Services and how can we help you with your research!

Introduction

In behavioral neuroscience, the Open Field Test (OFT) remains one of the most widely used assays to evaluate rodent models of affect, cognition, and motivation. It provides a non-invasive framework for examining how animals respond to novelty, stress, and pharmacological or environmental manipulations. Among the test’s core metrics, the percentage of time spent in the center zone offers a uniquely normalized and sensitive measure of an animal’s emotional reactivity and willingness to engage with a potentially risky environment.

This metric is calculated as the proportion of time spent in the central area of the arena—typically the inner 25%—relative to the entire session duration. By normalizing this value, researchers gain a behaviorally informative variable that is resilient to fluctuations in session length or overall movement levels. This makes it especially valuable in comparative analyses, longitudinal monitoring, and cross-model validation.

Unlike raw center duration, which can be affected by trial design inconsistencies, the percentage-based measure enables clearer comparisons across animals, treatments, and conditions. It plays a key role in identifying trait anxiety, avoidance behavior, risk-taking tendencies, and environmental adaptation, making it indispensable in both basic and translational research contexts.

Whereas simple center duration provides absolute time, the percentage-based metric introduces greater interpretability and reproducibility, especially when comparing different animal models, treatment conditions, or experimental setups. It is particularly effective for quantifying avoidance behaviors, risk assessment strategies, and trait anxiety profiles in both acute and longitudinal designs.

What Does Percentage of Time in the Centre Measure?

This metric reflects the relative amount of time an animal chooses to spend in the open, exposed portion of the arena—typically defined as the inner 25% of a square or circular enclosure. Because rodents innately prefer the periphery (thigmotaxis), time in the center is inversely associated with anxiety-like behavior. As such, this percentage is considered a sensitive, normalized index of:

  • Exploratory drive vs. risk aversion: High center time reflects an animal’s willingness to engage with uncertain or exposed environments, often indicative of lower anxiety and a stronger intrinsic drive to explore. These animals are more likely to exhibit flexible, information-gathering behaviors. On the other hand, animals that spend little time in the center display a strong bias toward the safety of the perimeter, indicative of a defensive behavioral state or trait-level risk aversion. This dichotomy helps distinguish adaptive exploration from fear-driven avoidance.

  • Emotional reactivity: Fluctuations in center time percentage serve as a sensitive behavioral proxy for changes in emotional state. In stress-prone or trauma-exposed animals, decreased center engagement may reflect hypervigilance or fear generalization, while a sudden increase might indicate emotional blunting or impaired threat appraisal. The metric is also responsive to acute stressors, environmental perturbations, or pharmacological interventions that impact affective regulation.

  • Behavioral confidence and adaptation: Repeated exposure to the same environment typically leads to reduced novelty-induced anxiety and increased behavioral flexibility. A rising trend in center time percentage across trials suggests successful habituation, reduced threat perception, and greater confidence in navigating open spaces. Conversely, a stable or declining trend may indicate behavioral rigidity or chronic stress effects.

  • Pharmacological or genetic modulation: The percentage of time in the center is widely used to evaluate the effects of pharmacological treatments and genetic modifications that influence anxiety-related circuits. Anxiolytic agents—including benzodiazepines, SSRIs, and cannabinoid agonists—reliably increase center occupancy, providing a robust behavioral endpoint in preclinical drug trials. Similarly, genetic models targeting serotonin receptors, GABAergic tone, or HPA axis function often show distinct patterns of center preference, offering translational insights into psychiatric vulnerability and resilience.

Critically, because this metric is normalized by session duration, it accommodates variability in activity levels or testing conditions. This makes it especially suitable for comparing across individuals, treatment groups, or timepoints in longitudinal studies.

A high percentage of center time indicates reduced anxiety, increased novelty-seeking, or pharmacological modulation (e.g., anxiolysis). Conversely, a low percentage suggests emotional inhibition, behavioral avoidance, or contextual hypervigilance. reduced anxiety, increased novelty-seeking, or pharmacological modulation (e.g., anxiolysis). Conversely, a low percentage suggests emotional inhibition, behavioral avoidance, or contextual hypervigilance.

Behavioral Significance and Neuroscientific Context

1. Emotional State and Trait Anxiety

The percentage of center time is one of the most direct, unconditioned readouts of anxiety-like behavior in rodents. It is frequently reduced in models of PTSD, chronic stress, or early-life adversity, where animals exhibit persistent avoidance of the center due to heightened emotional reactivity. This metric can also distinguish between acute anxiety responses and enduring trait anxiety, especially in longitudinal or developmental studies. Its normalized nature makes it ideal for comparing across cohorts with variable locomotor profiles, helping researchers detect true affective changes rather than activity-based confounds.

2. Exploration Strategies and Cognitive Engagement

Rodents that spend more time in the center zone typically exhibit broader and more flexible exploration strategies. This behavior reflects not only reduced anxiety but also cognitive engagement and environmental curiosity. High center percentage is associated with robust spatial learning, attentional scanning, and memory encoding functions, supported by coordinated activation in the prefrontal cortex, hippocampus, and basal forebrain. In contrast, reduced center engagement may signal spatial rigidity, attentional narrowing, or cognitive withdrawal, particularly in models of neurodegeneration or aging.

3. Pharmacological Responsiveness

The open field test remains one of the most widely accepted platforms for testing anxiolytic and psychotropic drugs. The percentage of center time reliably increases following administration of anxiolytic agents such as benzodiazepines, SSRIs, and GABA-A receptor agonists. This metric serves as a sensitive and reproducible endpoint in preclinical dose-finding studies, mechanistic pharmacology, and compound screening pipelines. It also aids in differentiating true anxiolytic effects from sedation or motor suppression by integrating with other behavioral parameters like distance traveled and entry count (Prut & Belzung, 2003).

4. Sex Differences and Hormonal Modulation

Sex-based differences in emotional regulation often manifest in open field behavior, with female rodents generally exhibiting higher variability in center zone metrics due to hormonal cycling. For example, estrogen has been shown to facilitate exploratory behavior and increase center occupancy, while progesterone and stress-induced corticosterone often reduce it. Studies involving gonadectomy, hormone replacement, or sex-specific genetic knockouts use this metric to quantify the impact of endocrine factors on anxiety and exploratory behavior. As such, it remains a vital tool for dissecting sex-dependent neurobehavioral dynamics.
The percentage of center time is one of the most direct, unconditioned readouts of anxiety-like behavior in rodents. It is frequently reduced in models of PTSD, chronic stress, or early-life adversity. Because it is normalized, this metric is especially helpful for distinguishing between genuine avoidance and low general activity.

Methodological Considerations

  • Zone Definition: Accurately defining the center zone is critical for reliable and reproducible data. In most open field arenas, the center zone constitutes approximately 25% of the total area, centrally located and evenly distanced from the walls. Software-based segmentation tools enhance precision and ensure consistency across trials and experiments. Deviations in zone parameters—whether due to arena geometry or tracking inconsistencies—can result in skewed data, especially when calculating percentages.


  • Trial Duration: Trials typically last between 5 to 10 minutes. The percentage of time in the center must be normalized to total trial duration to maintain comparability across animals and experimental groups. Longer trials may lead to fatigue, boredom, or habituation effects that artificially reduce exploratory behavior, while overly short trials may not capture full behavioral repertoires or response to novel stimuli.


  • Handling and Habituation: Variability in pre-test handling can introduce confounds, particularly through stress-induced hypoactivity or hyperactivity. Standardized handling routines—including gentle, consistent human interaction in the days leading up to testing—reduce variability. Habituation to the testing room and apparatus prior to data collection helps animals engage in more representative exploratory behavior, minimizing novelty-induced freezing or erratic movement.


  • Tracking Accuracy: High-resolution tracking systems should be validated for accurate, real-time detection of full-body center entries and sustained occupancy. The system should distinguish between full zone occupancy and transient overlaps or partial body entries that do not reflect true exploratory behavior. Poor tracking fidelity or lag can produce significant measurement error in percentage calculations.


  • Environmental Control: Uniformity in environmental conditions is essential. Lighting should be evenly diffused to avoid shadow bias, and noise should be minimized to prevent stress-induced variability. The arena must be cleaned between trials using odor-neutral solutions to eliminate scent trails or pheromone cues that may affect zone preference. Any variation in these conditions can introduce systematic bias in center zone behavior. Use consistent definitions of the center zone (commonly 25% of total area) to allow valid comparisons. Software-based segmentation enhances spatial precision.

Interpretation with Complementary Metrics

Temporal Dynamics of Center Occupancy

Evaluating how center time evolves across the duration of a session—divided into early, middle, and late thirds—provides insight into behavioral transitions and adaptive responses. Animals may begin by avoiding the center, only to gradually increase center time as they habituate to the environment. Conversely, persistently low center time across the session can signal prolonged anxiety, fear generalization, or a trait-like avoidance phenotype.

Cross-Paradigm Correlation

To validate the significance of center time percentage, it should be examined alongside results from other anxiety-related tests such as the Elevated Plus Maze, Light-Dark Box, or Novelty Suppressed Feeding. Concordance across paradigms supports the reliability of center time as a trait marker, while discordance may indicate task-specific reactivity or behavioral dissociation.

Behavioral Microstructure Analysis

When paired with high-resolution scoring of behavioral events such as rearing, grooming, defecation, or immobility, center time offers a richer view of the animal’s internal state. For example, an animal that spends substantial time in the center while grooming may be coping with mild stress, while another that remains immobile in the periphery may be experiencing more severe anxiety. Microstructure analysis aids in decoding the complexity behind spatial behavior.

Inter-individual Variability and Subgroup Classification

Animals naturally vary in their exploratory style. By analyzing percentage of center time across subjects, researchers can identify behavioral subgroups—such as consistently bold individuals who frequently explore the center versus cautious animals that remain along the periphery. These classifications can be used to examine predictors of drug response, resilience to stress, or vulnerability to neuropsychiatric disorders.

Machine Learning-Based Behavioral Clustering

In studies with large cohorts or multiple behavioral variables, machine learning techniques such as hierarchical clustering or principal component analysis can incorporate center time percentage to discover novel phenotypic groupings. These data-driven approaches help uncover latent dimensions of behavior that may not be visible through univariate analyses alone.

Total Distance Traveled

Total locomotion helps contextualize center time. Low percentage values in animals with minimal movement may reflect sedation or fatigue, while similar values in high-mobility subjects suggest deliberate avoidance. This metric helps distinguish emotional versus motor causes of low center engagement.

Number of Center Entries

This measure indicates how often the animal initiates exploration of the center zone. When combined with percentage of time, it differentiates between frequent but brief visits (indicative of anxiety or impulsivity) versus fewer but sustained center engagements (suggesting comfort and behavioral confidence).

Latency to First Center Entry

The delay before the first center entry reflects initial threat appraisal. Longer latencies may be associated with heightened fear or low motivation, while shorter latencies are typically linked to exploratory drive or low anxiety.

Thigmotaxis Time

Time spent hugging the walls offers a spatial counterbalance to center metrics. High thigmotaxis and low center time jointly support an interpretation of strong avoidance behavior. This inverse relationship helps triangulate affective and motivational states.

Applications in Translational Research

  • Drug Discovery: The percentage of center time is a key behavioral endpoint in the development and screening of anxiolytic, antidepressant, and antipsychotic medications. Its sensitivity to pharmacological modulation makes it particularly valuable in dose-response assessments and in distinguishing therapeutic effects from sedative or locomotor confounds. Repeated trials can also help assess drug tolerance and chronic efficacy over time.
  • Genetic and Neurodevelopmental Modeling: In transgenic and knockout models, altered center percentage provides a behavioral signature of neurodevelopmental abnormalities. This is particularly relevant in the study of autism spectrum disorders, ADHD, fragile X syndrome, and schizophrenia, where subjects often exhibit heightened anxiety, reduced flexibility, or altered environmental engagement.
  • Hormonal and Sex-Based Research: The metric is highly responsive to hormonal fluctuations, including estrous cycle phases, gonadectomy, and hormone replacement therapies. It supports investigations into sex differences in stress reactivity and the behavioral consequences of endocrine disorders or interventions.
  • Environmental Enrichment and Deprivation: Housing conditions significantly influence anxiety-like behavior and exploratory motivation. Animals raised in enriched environments typically show increased center time, indicative of reduced stress and greater behavioral plasticity. Conversely, socially isolated or stimulus-deprived animals often show strong center avoidance.
  • Behavioral Biomarker Development: As a robust and reproducible readout, center time percentage can serve as a behavioral biomarker in longitudinal and interventional studies. It is increasingly used to identify early signs of affective dysregulation or to track the efficacy of neuromodulatory treatments such as optogenetics, chemogenetics, or deep brain stimulation.
  • Personalized Preclinical Models: This measure supports behavioral stratification, allowing researchers to identify high-anxiety or low-anxiety phenotypes before treatment. This enables within-group comparisons and enhances statistical power by accounting for pre-existing behavioral variation. Used to screen anxiolytic agents and distinguish between compounds with sedative vs. anxiolytic profiles.

Enhancing Research Outcomes with Percentage-Based Analysis

By expressing center zone activity as a proportion of total trial time, researchers gain a metric that is resistant to session variability and more readily comparable across time, treatment, and model conditions. This normalized measure enhances reproducibility and statistical power, particularly in multi-cohort or cross-laboratory designs.

For experimental designs aimed at assessing anxiety, exploratory strategy, or affective state, the percentage of time spent in the center offers one of the most robust and interpretable measures available in the Open Field Test.

Explore high-resolution tracking solutions and open field platforms at

References

  • Prut, L., & Belzung, C. (2003). The open field as a paradigm to measure the effects of drugs on anxiety-like behaviors: a review. European Journal of Pharmacology, 463(1–3), 3–33.
  • Seibenhener, M. L., & Wooten, M. C. (2015). Use of the open field maze to measure locomotor and anxiety-like behavior in mice. Journal of Visualized Experiments, (96), e52434.
  • Crawley, J. N. (2007). What’s Wrong With My Mouse? Behavioral Phenotyping of Transgenic and Knockout Mice. Wiley-Liss.
  • Carola, V., D’Olimpio, F., Brunamonti, E., Mangia, F., & Renzi, P. (2002). Evaluation of the elevated plus-maze and open-field tests for the assessment of anxiety-related behavior in inbred mice. Behavioral Brain Research, 134(1–2), 49–57.

Written by researchers, for researchers — powered by Conduct Science.