


Fluorescence microscopy is a specialized type of light microscopy that relies on the phenomena of fluorescence or phosphorescence. These terms describe materials that absorb light (photons) of one wavelength, then re-emit light of a second, longer wavelength.[1]
The difference between fluorescence and phosphorescence is that the latter lasts much longer after the illumination is turned off.
In fluorescence microscopy, optical filters are used to illuminate the specimen with one wavelength, and selectively detect only a single wavelength of light coming back from the specimen.
Therefore, any part of the specimen that absorbs light at the illumination wavelength, and emits it at the detection wavelength, will be seen by the observer. This provides a powerful contrast technique that isn’t available in other types of microscopes.
The optical components that are used to control and filter light in fluorescence microscopy are described in detail in the “Parts of the fluorescence microscope” section below.
Some materials (known as ‘auto-fluorescent’ materials) exhibit fluorescence naturally and do not need to be specially prepared for fluorescence microscopy. Detection of auto-fluorescent materials relies mainly on selecting the appropriate filters matching the natural excitation and emission wavelengths.
For most practical specimens, fluorescent dyes known as fluorophores which exhibit relatively intense fluorescence at specific wavelengths, are used to tag selected parts of the specimen.
This is similar to the way that normal optical dyes or stains are used in light microscopy. These fluorophores can be extremely selective, to the point where, in some cases, single molecules are detected.[2]
Due to the high degree of contrast available by using fluorophores, fluorescence microscopy has become an important tool in the life sciences.
Here, specimens can be extremely complicated in both composition and structure, so their analysis is aided by the additional contrast provided by fluorescence tagging. In the second half of the 20th century, two techniques were developed that greatly added to the capabilities of fluorescence microscopy:
The fluorophores themselves are usually organic molecules with conjugated aromatic groups as part of their structure. A common example of a fluorophore is fluorescein isothiocyanate or FITC.
Some fluorophores can also change their fluorescence properties in the presence of other compounds, allowing those other compounds to be detected indirectly. An example of this is calcium imaging, where fluorophores having an aminopolycarboxylic acid structure bind specifically to Ca2+ ions and change their fluorescence properties.
In this article, we will discuss in more detail the important aspects of fluorescence microscopy, including the most common types of fluorescence microscopes used in modern labs, some of the available analytical techniques in fluorescence microscopy, and practical aspects of using these tools.
While all fluorescence microscopes work by roughly the same core principles,[3] there are several different subtypes, with varying levels of complexity and specialization.
In this method, the entire specimen is illuminated by the light of a single wavelength (the excitation wavelength) at one time. The parts of the specimen that fluoresce at this wavelength will absorb it, then re-emit it at another wavelength (the emission wavelength).
The excitation light can also reflect off the sample, or pass through it. The basic elements of this microscope are very similar to a normal reflected light microscope.
However, fluorescence microscopes contain additional optics, shown in Figure 1, that ensure the sample is illuminated by only the excitation wavelength, and that allow only light of the emission wavelength to reach the detector or observer.
Wide-field epifluorescence microscopes are the simplest and most common of fluorescence microscopes. Often, epifluorescence microscopy is a simple add-on to an existing optical microscope.
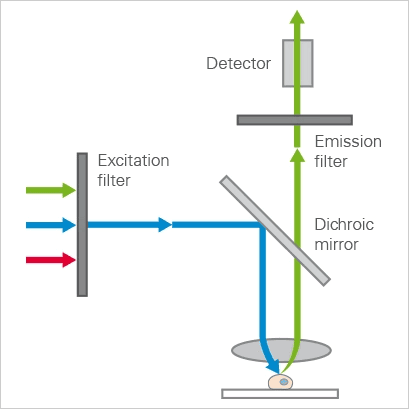
Figure 1: A schematic of the optical path in a simple wide-field epifluorescence microscope [10]
In a standard confocal microscope, an additional set of optics is used so that only light from a small point, in a narrow focal plane in the specimen reaches the observer, and any out-of-focus light is rejected.
A set of electronically controlled elements quickly scans the location of this point across the entire specimen. The resulting image consists of a thin slice through the specimen, which can be assembled into a three-dimensional representation if the depth of the focal plane is also scanned.
A confocal fluorescence microscope works using the same mechanism, but with the addition of optical elements like those used in wide-field epifluorescence microscopy. In addition, some confocal fluorescence microscopes use a laser as the source, giving the additional advantage of very high brightness and a narrow excitation wavelength band.[4]
Confocal imaging is particularly useful in fluorescence microscopy since stray fluorescence emissions from locations in front of and behind the focal plane are rejected.
When a beam of light reflects off of an interface, for example, the interface of a glass coverslip and a water-based medium below it, an evanescent wave of light is formed on the waterside of the coverslip.
This wave, which is the same wavelength as the reflected light, is extinguished within 100-200 nm of the interface. So when using this evanescent wave to excite fluorescent molecules on the waterside of the cover glass, only molecules within 100-200 nm of the glass are illuminated.[5]
This illumination technique, known as total internal reflection (or TIRF), therefore is extremely selective in the sense that it only detects molecules that are very close to the cover glass.
As an example, this technique can be used to image cells that are attached to the cover glass, without stray fluorescence emissions coming from the background medium.
The parts of a common wide-field epifluorescence microscope are described below (also shown in Figure 1), following the path of the light from the source to the observer.
Because of the relatively low signals being measured in fluorescence microscopy, the light used must have high luminance (intensity of light emitted per unit area), at the excitation wavelength of interest.
The required intensity can be achieved by either using a broad-band source, such as a mercury or xenon arc source, a high-powered LED, or a laser source.[5]
The selection of light source is usually based on the type (point source or wide-field), intensity, and luminance needed. For these reasons, broadband arc sources or LEDs are typically used for wide-field epifluorescence, while laser sources are now more commonly used in confocal microscopes.
One key element in fluorescence microscopy is that the specimen is illuminated with light of a specific and narrow wavelength. The purpose of the excitation filter is to narrow the wavelength of the light that illuminates the sample.
After passing through the excitation filter, the light is reflected off of a dichroic mirror (also called a dichromatic mirror or beamsplitter), towards the specimen. At the excitation wavelength, this element reflects most of the light, like a normal mirror.
However, it transmits most light at the emitted wavelength. In this way, the dichroic mirror acts as a gate, reflecting the light of the excitation wavelength while allowing the emitted wavelength to pass.
The optical transmission percentage of an example dichroic mirror (as well as a corresponding excitation and emission filters) is shown in Figure 2.
Figure 2: Transmission fraction as a function of light wavelength for an example set of excitation and emission filters, and dichroic mirror.[11]
The light then passes through a set of optics which act as both the condenser, collecting the light into a narrow beam on the sample, as well as a focusing objective for the light emitted back from the specimen.
The sample stage holds the specimen and generally has either manually or computer-controlled x, y, and z-axis motion.
The light coming from the specimen contains light reflected from the sample, which will be the excitation wavelength and emitted light from the fluorescent parts of the specimen.
In some samples, there may be various fluorescent materials present, so there may be light of additional wavelengths emitted. The emission filter removes all light except for the desired wavelength.
The excitation filter, dichroic mirror, and emission filter can be contained in a single structure called the filter cube.
Most modern fluorescence microscopes have a trinocular eyepiece setup, where the light that passes through the emission filter is directed either to a set of eyepieces for the observer or to a camera. A combination of digital imaging and image processing can then be used for quantitative analysis of fluorescence images.
For a number of microscopy techniques, the most important and challenging aspect of the analysis is sample preparation.
This is especially true in the case of fluorescence microscopy. The complexity in the sample preparation procedure is how to fluorescently label the structures of interest.
In most cases, the structure of interest will not be naturally fluorescent, so a method needs to be used to reliably attach a fluorescent dye to the structure. There are many such methods available, of varying levels of specificity and complexity.[6]
Once fluorescent tagging is accomplished, analysis by fluorescence microscopy is done similarly to analysis using a normal optical microscope.
In general, these steps are:
While performing the analysis, it is important to keep in mind that fluorophores can be sensitive to photobleaching.
This process, in which fluorophores permanently lose their fluorescence properties after a certain amount of exposure to the excitation light, is caused by chemical reactions within the fluorophore, or between it and the surrounding medium.
Fluorophores have varying levels of susceptibility to photobleaching, so in some cases, the problem can be avoided by switching to a more stable dye. If not, photobleaching can also be mitigated by reducing the exposure time or the exposure intensity, by using attenuating filters or a less intense light source.
For quantitative analysis, when the absolute intensity of emitted light needs to be measured, a curve of photobleaching vs. time can be generated, then the measured data can be corrected based on this curve.[8]
Photobleaching can also be used as a tool for analysis. For example, in the FRAP technique (fluorescence recovery after photobleaching), a selected area of a specimen is intentionally photobleached. The recovery of fluorescence in the photobleached area is then a measure of the diffusion rate of fluorescently tagged molecules back into that area.[9]
The guidelines for caring for a fluorescence microscope are very similar to those for an optical microscope:
The wide-field epifluorescence microscope can be considered to be a variation of a normal optical microscope, with the ability to detect fluorescently labeled molecules in a specimen.
This provides a new dimension of contrast. This analogy extends to confocal fluorescence microscopy, which has the capability of combining the high degree of spatial resolution of confocal microscopy with fluorescence.
TIRF microscopy is a potentially powerful technique with a depth of field even smaller than confocal microscopy, and has the potential for single-molecule imaging.
The main drawback to fluorescence microscopes is that they require the use of fluorophore labeling, which can increase the complexity of sample preparation. Furthermore, the common epifluorescence microscopes are limited by the same diffraction issues as other light microscopes.
Electron microscopes, such as scanning and transmission type, have better magnifying power than fluorescence microscopes. Also, scanning probe microscopes will in most cases have superior sensitivity to surface topography.


Monday – Friday
9 AM – 5 PM EST
DISCLAIMER: ConductScience and affiliate products are NOT designed for human consumption, testing, or clinical utilization. They are designed for pre-clinical utilization only. Customers purchasing apparatus for the purposes of scientific research or veterinary care affirm adherence to applicable regulatory bodies for the country in which their research or care is conducted.