

The word ‘optogenetics’ was originally utilized with reference to the field of neuroscience, to depict the method of using light to image and control neuronal function in the entire living mind. The notion of controlling biological activity with the use of light has been around for quite a while. In fact, the utilization of the method as a truly empowering tool in the area of neuroscience had been predicted beforehand. Over the previous decade, the remarkable potential of optogenetics has received widespread acknowledgment. The achievements of optogenetics in neuroscience have caught the interest of numerous researchers and specialists in different fields, and now the meaning of optogenetics has expanded to incorporate the general field of biotechnology that merges genetic engineering and optics to allow the gain or loss of well-defined activities in the intact animal.
In recent years, the optogenetics technique has had a significant effect on neuroscience research by allowing the control of specific types of cells in the intact brain. A noteworthy development that allowed using these tools was the capability to control specific cell types in intact frameworks with high spatial and temporal resolution. Another possibly transformational prospect would be the combination of optical control strategies with different detection techniques to allow closed-loop control of biological frameworks. A few studies have already demonstrated closed-loop control of neural circuits and feedback-regulated control of cell signaling and degrees of gene expression. The research proposed that optogenetic techniques will allow researchers to uncover the underlying function behind complex intracellular signaling frameworks or multicellular dynamics and precisely alter it to accomplish an ideal outcome. They will likewise enable us to create and analyze models of intact, complex biological processes, beginning a period of constant ‘process engineering’ in biological frameworks. Optogenetics may allow the utilization of highly developed process engineering methodologies generally utilized in chemical and electrical processes to biological processes.
Successful advancement of new optogenetic devices and their implementation is an interdisciplinary endeavor that calls for devices custom-made to the particular biological method being examined. Targeting and acquiring optimal expression in the preferred cell type should be tested, and the biophysical attributes of photoreceptors used should be refined according to the spatial and temporal characteristics to be controlled. Hence, users of optogenetic instruments need to consider biophysical qualities carefully, and developers of the optogenetic tools need to find ways to adjust them.
Cell-type specificity is an important aspect of optogenetic research. In various ways, gain or loss of function tests on distinctive cell types are similar to genetic knock-in or knockout analyses in molecular biology. Nevertheless, while the meaning of gene is clear, the meaning of cell type can be vague and unpredictable. This is especially valid in exceedingly complex frameworks, for example, the mammalian neocortex. To justify such high complexity, numerous parameters have been utilized to depict every cell type, for example, developmental lineage, anatomical position, gene expression, electrophysiology, and dendritic and axonal morphology. In any case, the latest developments in single-cell analysis procedures have given proof that gene expression patterns can represent a considerable number of these diverse cell phenotypes. Consequently, the utilization of genetically encoded instruments is all-around acceptable for examining the function of each cell type and is probably going to grow as we collect more information on gene expression.
In a set of extraordinary experiments, Liu and others demonstrated that neurons that increase movement during particular behavioral tasks in rodents could be explicitly reactivated utilizing the light-gated ion channel channelrhodopsin-2 (ChR2) propelled by the activity-dependent promoter of c-Fos. This reactivation reproduced the original behavior with just light activation, showing optically controlled memory recall. Ramirez and others later utilized a similar way to deal with trigger fear response by optically stimulating a lot of neurons activated during fear conditioning, indicating the formation of false memory. Theoretically, these demonstrations reveal that optogenetics can be utilized to reactivate cell populations particularly stimulated during a behavioral task, empowering activity-based targeting. In view of the diverse performance of transcription factors that can detect a wide variety of input signals, such responsive transcription might be a generalizable way to express optogenetic devices to control cell populations that direct a particular functional output.
The utilization of microbial rhodopsins in mammalian neural cells is an inspirational depiction of altering photoreceptors that exist in nature for controlling physiological characteristics in an entirely new context. To account for the diverse modes of activity originating in photoreceptors, the idea of repurposing parts that exist in nature to manage new biological functions has been employed in numerous applications and is estimated to grow further as new photoreceptors keep on being found. Microbial rhodopsins (type 1 rhodopsins) arbitrate either transmembrane ion transport or light-sensing through signal transduction. Microbial rhodopsins that arbitrate light-driven ion transport have been extensively utilized to control membrane potential in mammalian neurons. They can be classified into two mechanistically distinctive structures: ion pumps that can carry ions against their gradient and channels that passively transport ions along the gradient formed by other dynamic transporters.
Among some of the more popular microbial rhodopsins are channelrhodopsins originating in the green alga Chlamydomonas reinhardtii, which direct cations including proton, sodium, potassium, and calcium particles. Despite the fact that the conductance of these channels is moderately low, i.e. around 100-fold lesser than high-conductance ion channels), their current is able to depolarize mammalian neurons over their threshold to begin action potentials. Lately, more than 60 channelrhodopsin homologs were discovered by carrying out a methodical investigation of transcriptomes from 127 types of alga. This examination led to a high sensitivity channelrhodopsin with tremendously quick channel kinetics known as Chronos, and a red-sensitive channelrhodopsin named Chrimson. Concurrently, these channelrhodopsins facilitated independent multicolor stimulation of two distinct neural populations. Another up to date research discovered anion transporting light-gated channels in the cryptophyte Guillardia theta that allowed fast and reversible optical silencing of rodent neurons. Up until this point, microbial sensory rhodopsins have not been involved in optogenetic tests, maybe because of the transmembrane requisite or soluble transducers that are not easily compatible with other cell types.
In addition, animal rhodopsins form the biggest GPCR family—more than 700 rhodopsin-like GPCRs have been discovered in humans. In view of the widespread structure-function relationship studies of GPCRs, Khorana and colleagues established that the cytoplasmic areas of bovine rhodopsin might be supplanted by analogous sequences from a non-light sensitive GPCR, for example, β 2 – adrenergic receptor (β 2 – AR) to produce a chimeric light-sensitive β 2 – AR.
This technique has been expanded to generate light-driven rhodopsins coupled to Gq and Gs signaling pathways; Gi/o coupled pathways.
Apart from rhodopsin-based photoreceptors, light-sensitive proteins that exist in plants and microbes have been involved in directing cell signaling in various cell types including mammalian cells, yeast, and bacteria. This type of light-activated uncaging technique has been effectively applied in quite a lot of synthetic constructs such as a photoactivatable GTPase Rac1 and Cdc42, peptide-binding motifs, and tethered toxins. Despite the fact that such a photo-uncaging technique is by all accounts a generally relevant approach, in several incidents, it needs more than a few levels of optimization modified to every molecule for efficient control. While conformation-dependent exchanges are difficult to be anticipated, the design of a photoactivatable structure still poses a challenge. Such challenges might be solved by utilizing Dronpa, which is a photoactivated fluorescent protein that appears to permit the modular design of optical control. Upon activation by light, Dronpa alters fluorescence, as well as monomerizes through the unfolding of a β-sheet. This element has been utilized to design photoactivatable GTPases and proteases.
An added mode of activity that exists in photoreceptor domains is interaction upon inducing light. Several LOV domains, for example, the fungal LOV domain Vivid (VVD) and bacterial LOV domain EL222, homodimerize at the time of light activation. Plant photoreceptors, for example, Arabidopsis thaliana UVR8 exist as dimers in a dark environment however monomerize after being illuminated by UV light. Other photoreceptor domains, for example, Arabidopsis thaliana Cryptochrome-2 (CRY2) and Phytochrome B (PhyB) heterodimerize with a particular associate, cryptochrome-interacting basic helix– loop– helix 1 (CIB1) and phytochrome interacting factor (PIF), correspondingly. Such light-activated interactions have been utilized basically to direct intracellular signaling, by selecting signaling proteins to or away from a particular intracellular activity location, leading to signal activation or obstruction through sequestration. A few experiments additionally displayed optical control of DNA transcription utilizing light-induced binders that arbitrate the selection of transcription activation domains or activation of Cre recombinase.
Despite the fact that natural photoreceptor frameworks appear to depend on the modularity of light-induced protein domains for controlling various signaling pathways, the development of a new optogenetic device generally entails pronounced engineering efforts for efficient control. One major hurdle is accomplishing ample expression of optogenetic devices. As found in the case of microbial opsins, the expression level of an optogenetic tool might be one of the restricting components in accomplishing successful control. Heterologous expression of photoreceptor domains relies upon the host cell type and can result in decreased levels of the functionally active form of the optogenetic device. For instance, an examination that analytically evaluated channelrhodopsin homologs discovered that below 50% of them displayed discernible ion conduction when expressed in a mammalian cell line, and even lower amounts were functionally active in neurons. One approach to enhancing functional expression is to improve the protein trafficking to the preferred compartment utilizing targeting sequences. In any case, this methodology isn’t generalizable, and accomplishing sufficient expression of optogenetic instruments in the desired cell type remains a challenge. Another significant hurdle is the fact that optogenetic devices need multiple properties to be optimized. For instance, the basic properties of channelrhodopsins that affect their efficiency in controlling neural movement consist of ion conductance, light sensitivity, spectral sensitivity, channel kinetics, and ion selectivity.
Structure-guided mutagenesis experiments have led to enhanced channelrhodopsins with rapid kinetics, improved photocurrent, red-shifted spectral sensitivity, and modified ion selectivity. These investigations showed that vital properties could be adjusted utilizing mutagenesis, but in addition, discovered that a single mutation frequently influences multiple properties. For instance, mutations at E123 in ChR2 that are analogous to D85, which is the Schiff base counter-ion in bacteriorhodopsin, influence channel kinetics and red-shifts the motion spectra. Mutation H134R in ChR2 improves photocurrent maybe because of enhanced membrane expression; however, decreases channel kinetics. Mutations C128 and D156 decrease the channel kinetics significantly which facilitates keeping open channels for longer timeframes and successfully improves the light sensitivity. The pattern of multiple property modulation by a sole mutation is likewise found in LOV domains. For instance, in the Avena sativa phototropin 1 LOV2, mutations in the extremely persevered residue Q513 lessen the structural modifications between the dark and the illumination state and decrease the dark state return rate. Likewise, in the LOV domain VVD, mutations in M135 and M165 reduce recovery kinetics and improve the affinity of the illumination state VVD dimer.
In this way, optimization of an optogenetic instrument requires multidimensional characterizations to quantify every basic parameter, and in specific cases, individual properties might not be independently optimized. So, the fitness landscape of photoreceptors is a multidimensional space made out of possibly dependent factors. Since characteristic screens utilized for protein engineering depend on the quick estimation of a couple of parameters, techniques including directed evolution to optimize one parameter may lead to de-optimization of others that are necessary for device performance. As of now, the general approach is to unite arbitrary mutagenesis-based techniques with structure-guided methodologies and depend on the additive valuable effects of multiple mutations to produce an ideal construct. Furthermore, screens that can characterize multiple parameters might, in the future, be produced to execute multidimensional optimizations.
Another significant pathway in optogenetics has been to utilize various colors of light to control two autonomous cell types or procedures utilizing photoreceptor domains that have unique spectral sensitivities. This methodology has been investigated at length by utilizing microbial opsins. For example, ChR2, which has maximal sensitivity to blue light, has been merged with a halorhodopsin which can be stimulated with yellow light to allow bidirectional control of neural movement. Proton pumps with a division in their spectral sensitivity have been utilized to accomplish two-color neural silencing. Despite the fact that these experiments exhibited that activating or reducing action potentials in neurons can be controlled by using the diversity in spectral sensitivity of microbial rhodopsins, a new study demonstrated that accomplishing multicolor control depending on spectral separation alone may lead to cross talk, because of the innate blue-light sensitivity found in rhodopsins.
In fact, the red-sensitive channelrhodopsin Chrimson appears to activate action potentials under powerful blue light in neurons with high expressions levels. Nevertheless, an in-depth biophysical characterization of Chrimson showed that its channel opening rate under blue light is considerably slower than that under red light, and is likewise reliant on light intensity. As a result, cross-activation of neurons under blue light was reduced by combining Chrimson with the quick and light-sensitive channelrhodopsin Chronos and restricting the power and duration of blue light. The blue-light sensitivity of microbial rhodopsins may not be totally eliminated except if the chromophore itself is changed. Numerous photoreceptors, including LOV domains and cryptochromes, are likewise maximally sensitive to blue light, which might be difficult to eradicate as in the case of microbial rhodopsins. Thus, techniques other than depending on spectral separation alone, for instance, using differences in light sensitivity and kinetics under blue light might be important to lessen cross talk for multicolor control utilizing different photoreceptors.
Despite the fact that the concept of multicolor control in optogenetics may appear to be similar to multicolor fluorescence imaging, there are practical differences that entail caution in designing optogenetic studies with various light sources. In multicolor fluorescence imaging, cross-activation of fluorophores happens frequently; however, the outflow from multiple fluorophores can be filtered to acquire cross-talk free images. In studies utilizing light-inducing proteins, any cross-activation may lead to changes that cannot be filtered or removed.
Contingent upon the biological investigation being performed, small changes triggered by cross-activation may become significant, for example, in studies that emphasize subthreshold changes in membrane potential. Hence, when designing studies that entail various sources of light, for example, utilizing light-gated ion channels with calcium reporters, the wavelength and force of light utilized for imaging ought to be tested for cross-activation of optical actuators. It is noteworthy that blue-sensitive channelrhodopsins that appear to have insignificant red sensitivity can depolarize membrane potential under strong red light. Therefore, techniques that capitalize on all the characteristics of biophysical properties of photoreceptors might be utilized to stop cross-activation but may be hard to entirely remove small cross talks induce entirely.
In general, optogenetic devices can be driven by cell-type-specific promoters or enhancers to accomplish cell-type-specific expression. However, it is unusual to come across a single genetic regulatory component limited to a particular cell type. Therefore, this method may not be appropriate. Typically, cell identity appears to be characterized by a combination of multiple gene expression patterns. In case, the cell-type-specific genetic regulatory components are available; they may not have a sufficiently high expression of optogenetic instruments for productive control. Furthermore, the complete transcription unit and all related regulative components are involved when it comes to reproducing endogenous expression patterns of genes. These components may be unclear in many cases and can be difficult to transport.
A broadly utilized technique to accomplish cell-type-specific expression that circumvents problems is utilizing viral vectors in transgenic animals expressing recombinase in the genetically defined cell population. In this technique, viral vectors, for example, lentivirus or adeno-associated virus (AAV) support an optogenetic instrument under moderately strong promoters, for example, EF-1α promotor. The optogenetic apparatus encoding gene is at first present in the reverse frame to circumvent expression and needs recombinase movement for inversion and later expression. The recombinase gene expression is determined in genetically defined cell types, for which the expression level is somewhat insignificant. Cre-recombinase has been generally utilized for this reason, because of the accessibility of the increasing number of cell-type-specific Cre-transgenic lines.
In recent times, this technique has been additionally expanded to allow the targeting of neural cell types characterized by numerous genetic markers. Transgenic animals that are able to express multiple recombinases driven by autonomous promoters are infected with viral vectors transmitting a mixture of these recombinase sites, leading to intersectional targeting. Utilizing viral vectors additionally facilitates other valuable modes of targeting. One technique involves targeting neurons on the basis of their axonal projections or synaptic connectivity. For instance, a modified rabies virus can retrogradely change neurons, whereas the herpes simplex virus and vesicular stomatitis virus can anterogradely transmit across axon terminals.
These viruses can be utilized to transport Cre-recombinase transsynaptically, enabling the targeting of neurons projecting to a genetically defined population. It was additionally revealed that specific serotypes of AAV also could arbitrate effective retrograde transduction. These devices allow targeting optogenetic instruments on the basis of their axonal projection and possibly synaptic connectivity. One other targeting approach is to express genes utilizing promoters and enhancers stimulated by neuronal movement. These genetic components were distinguished from recent early genes that are known to initiate expression upon neuronal movement quickly. In several cases, these elements are activated by calcium influx that stimulates calcium-dependent kinases. These promoters have been utilized to explicitly express optogenetic tools in neurons that gain movement during particular social tasks in rodents, for example, fear conditioning.
For the process of using microbial rhodopsins in mammalian neural cells, all known light-driven ion pumps lead to hyperpolarization of membrane potential by the outer movement of a proton or internal movement of chloride particle. At the point when heterologously expressed in mammalian neurons, they produce enough current to allow optical silencing. Recently, a light-driven chloride pump that is highly sensitive toward far-red light named Jaws was depicted, which facilitated noninvasive neural silencing through the mouse skull. A light-driven outward sodium siphon (KR2) has additionally been just discovered, that might be utilized for optical silencing of neurons. In contrast to ion pumps, microbial rhodopsin ion channels are unable to transport ions against their gradient, however, allow the control of membrane potential by means of selective conduction of particular ions.
Additionally, animal rhodopsins (type II rhodopsins) share structural homology to microbial rhodopsins, yet function as G-protein coupled receptors (GPCRs) that at the time of light illumination, catalyze GDP to GTP exchange in heterotrimeric G proteins. Heterologous expression of unmodified types of rhodopsins allows light-driven stimulation of endogenous G proteins of the host cell. In contrast to the microbial rhodopsins that keep the retinal chromophore all through the photocycle, some animal rhodopsins, for example, bovine rhodopsin loses the chromophore after light stimulation, entailing a steady supply of retinal cofactors. Luckily, in mammalian cells and brain tissue, an adequate amount of retinal cofactors are available to create sufficient functional rhodopsins. Nevertheless, even in cell types where the retinal chromophore is scarce, the retinal cofactor supplementation might be evaded by utilizing ‘non-blanching’ G-protein coupled opsins that continue to be associated with the chromophore.
Furthermore, light-sensing proteins originating in plants and microbes work by stimulating light-activated conformational change attached to other protein domains, homo/heterodimerization, or multimerization. An important example that experiences conformational change at the time of light illumination is the Light-Oxygen-Voltage (LOV) domains that exist in photoreceptor frameworks of plants, fungi, and bacterial organisms. In these frameworks, LOV domains may be in charge of the movement within an effector domain directly fused to it by means of allosteric coupling or steric inhibition. For instance, the bacterial chemosensor FixL was made light-activated by substituting its Per-ARNT-Sims (PAS) motif (which is homologous in structure to LOV domains) with the LOV domain Ytva. In this model, an α-helical coiled-coil linker of the LOV domain experiences a rotational motion upon light illumination, which sets in motion a histidine kinase domain fused to it. In other models, the conformational change in the LOV domain results in the unfolding of an α-helix in the lit-state, bringing about ‘uncaging’ of the effector domain fused to it.
The beginning of the dawn of optogenetics in neuroscience dates back to the ground-breaking work of Ramón y Cajal. Cajal brought forth basic proof of the fact that neurons are the signaling unit of the nervous system, and that they may be present in numerous distinguishing morphologies. From that point forward, studies were conducted to demonstrate that in fact several different kinds of neurons exist, categorized on the basis of their physiological attributes, anatomical position, morphology, and gene expression profile. The number of cells that occur in the human brain is still unclear. However, it is hypothesized that there are around 1000 neuronal cell types just inside the mammalian cortex.
Generally, it is established that a particular cell type performs the same role within a neural circuit. Consequently, the classification of all cell types and mapping out their connectivity is necessary to see how the nervous system functions. Classification of various cell types must be associated with functional identification within their regular setting, the nervous system. Therefore, neuroscientists have been searching for an approach to perturb individual cell types inside the brain.
This was clearly revealed by Francis Crick in his discussion released in 1979, in which he proposed the necessity for a technique by which all neurons of only one type could be inactivated, leaving the others essentially unaffected. Optogenetics is perhaps the first technological development that allows such experimentation. It makes the significant connection linking cell-type information and the capability to carry out gain or loss of function tests. Preceding the development of the optogenetics technique, experimental viewpoints in neuroscience proposed the usage of light as a means to control neural movement.
For instance, caged compounds like the secondary messenger molecules, ions, and neurotransmitters have been created that are at first static; however, turn out to be active after being illuminated by light. Despite the fact that these photochemical ways did not present any method to control explicit cell types, they laid the foundation for the utilization of millisecond timescale illumination in cells and tissue. Precise activation of cell-type neurons was initially accomplished in a series of ground-breaking work by the Miesenböck group, by heterologously expressing invertebrate rhodopsin with additional connecting proteins and ligand-gated ion channels that can be stimulated by synthetic photocaged precursors. During this time, microbial rhodopsins that work as single component light-gated ion channels were found. In mammalian neurons, these microbial photoreceptors could surprisingly be heterologously expressed to trigger action potentials with millisecond timescale accuracy optically. In fact, rhodopsins have covalently bound all-trans-retinal chromophore normally created in about all cell types as well as mammalian cells and tissues. The findings collectively catalyzed the wide selection of these particles in neuroscience.
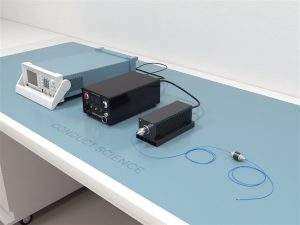
The optogenetics system typically consists of the following components: waveform generator, laser (b/g/y), patchcord, rotary joint, optical fiber, ceramic sleeves, ceramic ferrule (user’s choice of size), the protective cap for the ceramic ferrule, fiber stripper, laser goggles, and laser power meter.
The waveform generator has a 20 MHz sine, and 10 MHz pulse waveforms provide coverage for most common applications. The waveform generator has a 250 MS/s sampling rate and 14-bit vertical resolution enabling the creation of high-fidelity signals. The optogenetics laser has a choice of three colors including 473nm Blu-ray Laser-50mW/power, 532nm Green Laser-50mW/power, and 593nm Yellow Laser-50mW/power. The optogenetics patchcord has low insertion loss, good repeatability, high return loss, stable temperature, and good mutual insertion performance. The optogenetics optical fiber has a choice between core diameter, ferrule size, and numerical aperture. The optogenetics rotary joint is used in awake and freely moving animals to avoid fiber optic twining.
The optogenetics ceramic cannula comes in a package of 20 and is used in a temporary connection between two optical fibers. The optogenetics ceramic ferrule has an applicable wavelength of 400-2200nm and core diameter of 100um, 200um, 300um, and 400um. The optogenetics fiber stripper (tongs) is suitable for 100um-800um for stripping fiber coating and prevents damage to the fiber. The optogenetics laser goggles provide protection against green and yellow light. The optogenetics laser power meter is applicable to multiband measurement with a broad-spectrum range and has a short response time, good thermal stability, small volume, and convenient installation.
Evaluation of Pancreatic Islets
Reinbothe & Molletuse used the islets of an “optogenetic beta-cell” mouse line in islet batch incubations and Ca 2+ imaging experiments. Breed mice with Ins2Cre (“RipCre”) mice or a different cell-specific Cre-driver line were used to accomplish expression, particularly in beta-cells. The mouse islets were prepared by injecting collagenase into the common bile duct in accordance with the standard procedure. Dishes were prepared for whole islet imaging and incubated overnight in a humidified incubator at 37 °C. An LED illumination system was prepared for islet batch incubations, and an in vitro batch islet was stimulated with LED light. The tubes containing LEDs were placed on a rack into a water bath and incubated for 1 hour and stimulated with blue light. The control non-illuminated tubes were placed in another rack sealed with aluminum foil to stop any blue light from entering the control islets tubes. A maximum of 3.2 V was delivered to the LEDs, and after disconnecting and removing from the water bath, the sample was analyzed for hormones. Ca 2+ indicator loading of islets was performed, and the calcium imaging buffer 1 and 2 were adjusted with the glucose and potassium respectively. A fiber-coupled LED was used to stimulate the islets directly on an imaging microscope. A glass-bottom dish was marked with a dot in the middle and placed on the microscope stage directly in the visual center parallel to the central point where images are obtained. The fiber-coupled LED was switched on and aimed at the marked center of the glass bottom dish while viewing from a lateral spot. The power of the LED was decreased, and the LED was set in this position. The LED power source was switched to remote control mode and was afterward connected to the trigger box (TTL out) of the microscope acquisition system. Then, the plastic perfusion insert was placed into the glass-bottom dish holding the dye-loaded islets. The dish was placed on the microscope stage, and the islets were positioned in the visual center of the microscope. The low transmitted light was used to visualize, and several islets were brought into the field of view. The perfusion in-and-out nozzles were placed into the grooves of the insert. Perfusion began with 2.8 mM Calcium imaging buffer 1 at the rate of ~1 ml/min. The perfusion pump and temperature control system were turned on for the tube heating component. The temperature was stabilized at a value of less than 37 °C to stop unintended overheating of the islets because of temperature variations. Islets were then perfused for 5–10 min until temperature and buffer levels became stable. A positive signal was confirmed in the transgenic mouse islets and absence in the control islets. A test image of the islets was taken by illuminating at 340 and 380 nm settings. The optimal exposure times were noted down and maintained for the entire set of experiments. A light trigger protocol was created [3.5–5 V TTL signal out] so as to remote control the fiber-coupled LED for the preferred time period and frequency. Exposure time was taken into account to ensure that the islets were not stimulated at the same time as image acquisition. Then, a background region was marked for analysis as the region of interest (ROI) covering one or more than a few islets or parts. By the end of the light stimulation protocol, islets were perfused with calcium imaging buffer 1 (high glucose) or 2 (high potassium) serving as positive controls. Total Ca 2+ levels can be estimated after calibration with cells (islets) and ionophores, for instance, ionomycin or A23187, cell-free utilizing a dilution series of buffers with identified Ca 2+ level or both in combination. Optogenetics control of pancreatic islets facilitated light-induced insulin release and offered an all-optical solution to control and calculate intracellular Ca 2+ levels in pancreatic beta-cells.
Evaluation of Aversive Odor Learning in Drosophila
Riemensperger, Kittel, & Fiala manipulated selected elements of complex neuronal circuits to find out the causal relationships between neuronal activity and the effect on the functioning of neuronal circuits that control animal behavior. The optogenetic device was applied to an extensively utilized aversive olfactory learning model in adult Drosophila melanogaster. ChR2-XXL, a variant of Channelrhodopsin-2 (ChR2), was used to provide adequate light sensitivity, expression, and stability in order to depolarize fundamental brain neurons effectively in the fruit flies. A barrel-type olfactory training apparatus was used to conduct olfactory training of adult fruit flies through blue light stimulation. Drosophila expressing ChR2-XXL in neurons of significance were produced by crossing the proper Gal4 line with the transgenic UAS:chop2-XXL line. In the research, UAS: chop2-XXL was crossed with Th-Gal4, which drives expression in the bulk of dopaminergic neurons. The parental flies were taken out from the vials after the eggs were laid. During the growth stage and until the day of the experiment, the F1 generation was consistently kept in darkness. Due to the fact that ChR2-XXL is not activated by long-wavelength light, the vials were covered with red foil to avoid undesired photostimulation. To regulate natural odor preferences, the correct odor levels were equilibrated. ~100 flies were directly transferred into the T-maze division of the apparatus, and every odor was presented alone against pure mineral oil as a control. The preference index was estimated. The odor preference indices of the two odors were made equivalent by adjusting the odor levels accordingly. In the next step, both odorants were offered at the same time, and the preference index was determined. The odorant levels were balanced to such an extent that the flies were spread evenly between the two arms of the T-maze, i.e., it was made certain that the preference index was ~0. Ten minutes prior to each analysis, the flies were transferred below red light from the food vials into fly culture vials that were empty. The odorants 4-methyl cyclohexanol (CAS 589-91-3; Sigma) and 3-octanol (CAS 589-98-0; Sigma) were diluted in mineral oil (CAS 8042-47-5; Sigma) to the final concentration by vortexing carefully. Groups of about one hundred 4–7 days old flies were relocated beneath red light from the empty culture vials into the training tubes, and training began 1 min following the transfer of flies. Around 60 μl of the diluted odorant was applied to the odorant cups. Throughout associative training, each odor was offered successively for 1 min, with a 1 min break between both of the odorant stimulations. The odor utilized as the conditioned stimulus (CS+) was temporally synchronized with the blue light. The odor utilized as control (CS−) was presented following a 1 min break in total darkness. Flies were optogenetically trained by administering blue light with a peak wavelength of 468 nm and intensity of ~1 μW/mm 2 using 12 diodes equally placed on the tube surface. For training, 12 illumination pulses with a time interval of 1.25 s and split by 3.75 s were administered. Once the training cycle was finished, the flies were shifted to the T-maze part of the instrument where both odors were introduced from each side, and the flies were allowed to appropriate for 2 min. The testing was afterward carried out with new flies in the same way except that the odorant that was presented as CS+ in the primary analysis was now served as CS−. The flies were tallied, and the preference and learning indices were determined. Optogenetic activation of a population of dopamine-releasing neurons imitated the reinforcing quality of a punitive electric shock ordinarily utilized as an unconditioned stimulus. In temporal concurrence with an odor stimulus this artificially stimulated neuronal activity caused learning of the odor signal, in doing so produced a light-induced memory.
Evaluation of Locomotor Activity Modulation
Xu, Zhang, Guo, & Zheng used optogenetic techniques to depict locomotor activity modulation in free-behaving rats to enhance locomotor activity. The target locations of the rat brain were dorsal periaqueductal gray (dPAG) for the modulation of defensive behaviors and ventral tegmental area (VTA) for the modulation of reward behaviors. First, the guide cannula and the optical electrodes were prepared. The brain area and the coordinates to be stimulated were determined. The coordinates were selected in accordance with the rat brain atlas of Paxinos and Watson. An optic fiber tail was cut by a diamond stylus to the appropriate length as per the guide cannula length and the target site. The light attenuation of the optic fiber tail was measured. Afterward, the optical electrode was implanted, and the virus was injected. The animal was anesthetized, and the hair around the surgical area was removed with the help of a hair clipper, from between the eyes to the ears. The area was sterilized, and the animal was mounted on a stereotaxic device while utilizing a heating pad or towel for the animal to remain warm. The surface of the skull was exposed, and the connective tissue was removed with ophthalmic scissors and a dental spatula. The Bregma and Lambda sites on the skull were marked, and the coordinates were noted. The skull on top of the target site was detached cautiously, and the dura was peeled using an operating microscope. Holes were drilled for setting Ref electrode and skull screws. The electrode-bundled guide cannula was fixed to the cannula holding arm, repositioned, and lowered into the target site. The exposed tip of the Ref electrode wire was placed into the Ref hole in a parallel position between the skull and the dura. The skull-removed hole and the Ref hole were closed with a medical adhesive. The Handmix temporary crown and bridge material part were combined and applied rapidly between the cannula and the nearest screws for a preliminary fixation of the cannula. A microsyringe was prepared and held onto the microinjection pump. 3 μL paraffin oil was withdrawn at the speed of 3 μL/min, and 1 μL paraffin oil was infused at the rate of 6 μL/min. The virus was taken out from a −80 °C freezer and diluted with saline. Then, 1.5 μL virus liquid was withdrawn at the rate of 2 μL/min, and 200 nL was infused at 200 nL/min. The target site and the calculated coordinates were considered, and the tip of the needle was lowered into the injection depth. 200 nL virus was infused at 100 nL/min and repeated five times. The complete dosage of injection for every animal was 1 μL. A prepared optic fiber tail was connected with a mating sleeve. The fiber tip was connected to the cannula and lowered to the measured depth. Dental cement was built around the cannula and fiber mating sleeve. The animals were housed separately in the home cage for a minimum of 1 week for recovery. Next, the electrophysiological recording device was prepared by setting up the Plexon Multichannel Acquisition Processor OmniPlex. The optical stimulation pathway was prepared by setting up the pulse parameters for stimulation. The stimulation pulse frequencies and train burst widths were altered while the pulse duration was fixed at 15 ms. The laser device was warmed up, and the laser was connected to the patch cable. After the patch cable and the laser devices were successfully set up, the Omnetics connector was cautiously connected to the Plexon headstage, and the mating sleeve on the rat’s head was joined to the ceramic connector on the optic patch cable, respectively. The intensity of the laser was altered, and the electrophysiological signal modifications in animals were observed. A major increase in spike firing rate throughout the photostimulation indicated a strong expression of opsin, like Synp and ChR2. Optical stimulation on the dPAG site was performed by placing the animal in the behavioral field. The animal was left to explore the field for about 10 min. The stimulation in dPAG instigated defensive behaviors, from vigilance to characteristic freeze and escape as the stimulation became powerful. Optical stimulation on the VTA area was performed by placing the animal in the field. The animal was left for a 15-min period. The laser stimulation parameters were set up with 50 Hz frequency, 15 ms pulse width, and 0.2 s duration and were administered as one single stimulation. The stimulation in VTA resulted in the improvement of locomotor activity. The laser stimulation triggered the animal for long-term roaming and additional approaches into the middle section of the field.
Evaluation of an Optogenetics Viral Vector and Optical Cannula Implantation
Pawela, DeYoe, and Pashaie used the optogenetic neuromodulation technique to inject an optogenetic AAV virus into the rat cortex and to surgically embed an optical cannula for administering light to the deeper cortical layers. (I) First, an optogenetics viral vector was administered through an intracranial injection. The rat was anesthetized in an induction chamber and secured in a stereotaxic device with a nose cone attachment. The rat was prepared, and the fur was shaved off of the scalp and washed with iodine followed by rubbing alcohol. The washing procedure was repeated two times more. Preoperative injection of cefazolin antibiotic was administered subcutaneously, and carprofen analgesia was administered intramuscularly. A small midline incision (around 2 cm) was made in the rat scalp, and the dorsal surface of the calvaria was exposed. Bregma and lambda were included in this region to verify the accuracy of other calculated coordinates. The tissue was sharply dissected, and the bone was exposed. The skull was cleaned with hydrogen peroxide to emphasize the cranial sutures. The dorsoventral coordinates of bregma and lambda were found, and the bite bar position was adjusted until these readings were equivalent. The coordinates of the region of interest were calculated, and the position of injection sites was determined. A small hole was drilled through the calvaria at every injection site utilizing a 0.3 mm micro drill bit. The needle was filled with the chosen amount of virus and 0.5–1 μl extra virus was drawn. The needle was attached to the stereotactic arm of the injection system, and the pump was set to inject at 0.01 μl/min until the desired volume was achieved. The needle was advanced on the stereotaxic holder until it reached the surface of the skull above the position of the first injection. The dorsoventral coordinate was recorded, and the coordinate of the desired injection depth was calculated. The needle was carefully advanced to the chosen depth, and a wait of 5 min allowed the brain to equilibrate to the presence of the needle. The injection of the virus was initiated. After the pump finished injecting, 5 more minutes were given for the brain to equilibrate the additional volume of the injection, and the needle was then gradually removed. The steps were repeated for every injection site. After the injections were completed, the needle was removed, and the skin was sutured. (II)Next, the surgical implantation of the optical cannula was performed. Two to three weeks following the initial procedure, the rat was prepared following the same protocol. A midline incision of approximately 3.5 cm long was made in the rat scalp. The calvaria was exposed, and the temporalis muscle was bluntly dissected to expose the sides of the skull too. The skull was cleaned with hydrogen peroxide and dried utilizing electrocautery to end any persistent bleeding. The bregma was marked, and its coordinates were noted. The dorsoventral coordinates of bregma and lambda were calculated, and the site for the cannula placement was marked. A small hole was drilled for the cannula utilizing the 0.3 mm micro drill bit. The dura was punctured with the tip of the drill bit to make certain that the optical fiber achieves sufficient penetration. The cannula was attached to a stereotactic arm and positioned over the implantation area. The cannula was lowered into the implantation site, and a gap of about 0.5 mm was left between the bottom of the cannula and the surface of the skull. Then, the cannula was lowered until it touched the skull. The sides of the calvaria were exposed and cleaned with peroxide and dried. A hole was drilled in the side of the calvaria using a smaller drill bit. The outer edge of the hole was enlarged by hand using the larger drill bit. The small bone curette was utilized to even the edges of the hole. The nylon screw was trimmed to 0.5–1 mm in length and screwed completely into the hole. A spot of Loctite glue was applied to the skull and the screw and was allowed to dry. Dental cement was mixed to a thick consistency and applied to the screw area. The region was entirely covered and allowed to harden. A trail of cement was placed on top of the calvaria to the cannula. The procedure was repeated on the opposite side of the skull. Additional dental cement was combined and applied to the top of the skull, and a small heap was formed around the cannula. An adequate amount of space was left to fix the connector and the fiber optic cable to the laser. After the dental cement hardened, the skin was sutured shut, and the cannula was allowed to poke through. The viral vector stimulated a light-activating ion channel or ion pump, and the cannula implantation delivered light stimulation to the brain.
Evaluation of Optogenetic Approaches for Mesoscopic Brain Mapping
Kyweriga & Mohajerani utilized in-vivo optogenetic functional mapping methods merging optogenetic stimulation with regional voltage-sensitive dye imaging in transgenic mice to evaluate intrahemispheric and interhemispheric functional relationships. Transgenic animals were used. The transgenic mouse lines were combined with viral vectors for spatial control of optogenetic expression. The imaging equipment was properly set up, and optogenetics and VSD imaging were added. Lasers, LEDs, and arc lamps were used as the three primary light sources of stimulating opsins. The mouse was collected and placed into an isoflurane induction chamber, and the lid was locked. Dexamethasone was injected to decrease the possibility of cerebral edema. Glucose was injected into brain buffer (10–15 mL/kg, IP) to hydrate the mouse. All the hair around the surgical area was shaved. The mouse was placed onto the surgical table and positioned inside the nose cone. A rectal thermometer was used to ensure the body temperature remained at 37 °C. To accurately deliver meds and hydration fluids, a catheter was put into the right intraperitoneal space which reduced the possibility of stirring the animal when administering injections. The surgical site was scrubbed with Chlorhexidine and Ethanol to ensure that the mouse is areflexic to pain. The skin and muscle tissue over the target site was removed and skull landmarks, for instance, the midsagittal suture, lambda, bregma, or the squamosal bone were noted. Superglue was used around the edges of the craniotomy position. After it dried out, the tissue from the top of the skull to the foramen cistern was removed. The dura was exposed and pierced with a needle. A damp piece of gauze was placed over the drain to assist in the draining of CSF. Dental cement and jet accelerant were mixed, and the powder was poured into one of the wells in the 12-well porcelain plate. The jet liquid was added (about 1:1 ratio) and mixed well. Cement was added all around the craniotomy area to ensure that landmarks were fully visible. More cement was added until the well was built and a duration of 5–30 min was allowed for it to dry. The drill was used, and the craniotomy was commenced. Fine-tipped forceps or a microprobe and tiny spring scissors were used to remove the dura, and the well was filled with brain buffer. Next, the voltage-sensitive dye was prepared. The solution of dye and brain buffer was mixed with a vortex for 10 min on high. The tube was placed in an ultrasonic cleaner for 5 min to dissolve the dye additionally. The tube was allowed to rest for 10–20 min. Then it was centrifuged for 1 min at 12,000 rpm (g-force = 13,523 and filtered. Next, the brain was stained with voltage-sensitive dye. All brain buffer was carefully removed right before the dye was added. The dye was applied to the brain and allowed to soak for 60–120 min until the brain turned deep purple. The brain was protected by applying agar, and a glass coverslip was gently placed afterward. One end was placed down first and gradually lowered to remove air bubbles. Next, mesoscopic brain mapping was performed. The brain was illuminated with two red LEDs (620–640 nm excitation filter) and placed ~10 cm from the brain. A 473 nm laser was placed over cortical regions of interest via galvanometer scan mirrors and then passed through a dichroic mirror to the brain. Light released from the surface of the brain passed through a bandpass filter (673–703 nm) and was videotaped with a CCD camera. The camera was focused on the brain to image VSD activity until the blood vessels became blurry, a depth of approximately 500 μm. Each trial started with 300–500 ms of illumination with the red LED and after that laser stimulation of the region of interest or physical stimulation of the sensory system was executed. Random optogenetic stimulation of neurons was conducted, and 473 or 589 nm diode pumper solid-state lasers were used. The laser beam was positioned on the cortex, and the laser output was set to 5 mW utilizing a laser power meter. Combining the techniques of optogenetics and imaging to map functional circuits in vivo has led to new insights into neuronal functioning. This method facilitated the activation of nonprimary sensory areas and made the analysis of network activity and functional maps possible.
Evaluation of Confined Stimulation in Deep Brain Structures
Castonguay, Thomas, Lesage, & Casanova designed the in vivo application of a side-firing optical fiber sufficient for delivering light to particular areas within the subcortical brain region of the mice. First, the optical setup for the experiment was completed. Side-firing optical fiber and the mechanical system of the apparatus were prepared. Then, laser coupling was set up by fixing the laser source of the breadboard. A mirror with a kinematic mirror mount was placed at 45° with an incident laser beam to redirect the beam at a right angle. A neutral density filter was placed in the beam path which allowed modulation output power of the fiber. The collimator was fixed on an X and Y micromanipulator, and the laser beam was directed in the collimator. One end of the optical fiber was attached to the collimator. The mirror kinematic mount was utilized to fine-tune the beam angle, and the X and Y micromanipulators specifically focused the collimator on the beam, maximizing light emerging from the connected optical fiber. The free end of the optical fiber was connected to the stator of the rotary joint. Next, in-vivo optogenetic stimulation of deep brain structures was conducted by using mice expressing channelrhodopsin-2 (ChR2). The mice were anesthetized with an intraperitoneal injection and a subcutaneous injection. The hair around the neck and the head of the mice was removed and disinfected with iodine solution. The tracheotomy was conducted to facilitate easy breathing. Then, the animal was positioned inside a stereotaxic apparatus with a flow of pure oxygen, and body temperature was maintained at 38 °C utilizing a heating pad. The electrocardiogram was constantly supervised. At last, the head of the mouse was stereotaxically positioned to target the lateral geniculate nucleus (LGN) of the mice. Then, the precise stereotaxic location of the LGN was determined in order to reach it with an optical fiber. The optical fiber entered the cortex with a 57° angle relative to the vertical. A small craniotomy of about 1 mm diameter was executed with a micro drill at −2.3 mm in relation to bregma in the sagittal axis and at 4 mm on the lateral axis. To verify the accuracy of the location, a tungsten microelectrode was initially utilized to document neural activity in the LGN. After the location of the LGN was established, the microelectrode was taken out and substituted by a 24G needle. The uncovered core of the optical fiber was then passed through the needle which was used to maintain similar coordinates as the microelectrode and to secure the optical fiber throughout its rotation. Then the optical fiber was lowered in the brain to the depth where visual responses were taken in order to stimulate neuronal activity in the LGN optogenetically. Intrinsic optical imaging (IOI) was used to achieve the recording of neural activation that represented an influential procedure to envision the global functional architecture of cortical regions in vivo. One method observed the slow intrinsic modifications in the optical characteristics of the active cortex over time. The cortex’s image was obtained directly through the skull, and a circular ring was positioned over the visual cortex as an imaging chamber. A 12-bit CCD camera equipped with a macroscopic lens was utilized to document cortical activity. Initially, the brain was illuminated at 545 nm to view the cortical vasculature at high contrast so as to alter the focus of the camera on the cortex. The light was directed from a filtered halogen bulb to the cortex utilizing a fiber optic bundle. Intrinsic optical signals were acquired by lighting up the cortex with a 630 ± 15 nm light, where absorption becomes sensitive to alterations in deoxyhemoglobin levels. To identify a finite volume of optogenetic activation, strict control of fiber illumination states was required. Single illumination pulses of 250 ms were utilized, a standard revealed to be suitable for the activation of channelrhodopsin-2. The output power from the optical fiber tip was modified from 1 to 10 mW/mm and the volumetric level of exciting neural tissue by light was restricted. Stimulus synchronization between optogenetic light pulse and IOI system was obtained using VDAQ software and Imager 3001 data acquisition hardware. Each trial period was repeated 20 times for any certain radial or axial position of the fiber. The designed fiber facilitated the sequential stimulation of subpopulations of neurons in the LGN, a thalamic region that obtains systematic inputs from the retina and projects to the visual cortex.
Evaluation of Atrial Cardiomyocytes
Feola, Teplenin, de Vries, & Pijnappels portrayed the optogenetic engineering of atrial cardiomyocytes (aCMCs) taken from 2-day-old Wistar rats utilizing a lentiviral vector (LV) technology followed by the activation of the light-sensitive proteins (i.e., ion channels) through light-emitting diodes (LEDs). First, isolation of aCMCs was carried out by anesthetizing 2-day-old Wistar rats. The hearts were quickly removed and collected in a plastic Petri dish. The atria were separated from the ventricles, and the atrial tissues were chopped into small pieces and washed with 4 ml of Solution A to remove erythrocytes. The pieces were transferred to a sterile 50 ml Erlenmeyer flask and incubated under gentle agitation at 37 °C for 35 min. The fully digested material (5 ml) was transferred to a sterile 15 ml polypropylene tube on ice, and the cells formed pellets by centrifugation for 10 min at 150 × g. The cell pellet was suspended in 12 ml of the pre-warmed growth medium, and the cell suspension was evenly divided over four Primaria cell culture dishes. This was incubated at 37 °C in a humidified 95 % air/5 % CO 2 atmosphere for a duration of 120 min to facilitate preferential attachment of non-cardiomyocytes. The growth medium with the non-adhered cells was passed through a nylon cell strainer to eliminate undigested tissue fragments and cell aggregates. The cells on fibronectin-coated glass coverslips were counted and seeded in 24-well cell culture plates. Next, fibronectin-coated glass coverslips were prepared, and antiproliferative treatment with mitomycin-c was performed. Vesicular stomatitis virus G protein (VSV-G)- pseudotyped SIN-LVs were produced by seeding of 293T cells in 175 cm 2 cell culture flasks. This was followed by transfection of 293T cells, and the transfection medium was replaced by DMEM-HG + 5 % FBS + 25 mM HEPES-NaOH (pH 7.4). The culture supernatants were harvested, and concentration/purification of the SIN-LV particles was conducted. Aliquoting of the concentrated SIN-LV suspensions was carried out by collecting the SIN-LV suspensions in one of the ultracentrifuge tubes. Each ultracentrifuge tube was rinsed with 100 μl of ice-cold PBS-1 % BSA, and the washed solution was transferred to the collection tube. The supernatant was divided on ice in 50–100 μl aliquots by utilizing pre-cooled 0.5 ml microtubes for storage at −80 °C. Transduction of aCMCs was carried out by thawing the SIN-LV stock on ice four days after aCMC isolation. The desired quantity of SIN-LV particles was added to the pre-warmed CMC medium + 5 % HI-HS. To allow homogenous distribution of SIN-LV particles, the medium was gently mixed and replaced with 400 μl of inoculum/well of a 24-well cell culture plate. The medium was refreshed around 24 h after transduction by aspirating the inoculums and rinsing the cells one time with PBS. 1 ml of prewarmed CMC medium + 5 % HI-HS/well was added to a 24-well cell culture plate. The optical mapping system was prepared by placing the plano-convex lens on top of the 470 mm LED. The LED assembly was then aligned with the center of the MiCAM ULTIMA-L camera. The lens-LED complex was connected to the stimulus generator. The aCMC Cultures were prepared, and the aCMC monolayers were checked for structural homogeneity, ±72 h following transduction, utilizing an inverted phase-contrast microscope. The aCMC monolayers were observed for homogeneousness of transgene expression by observing the intensified yellow fluorescent protein tag merged with the channelrhodopsin with the help of an inverted fluorescence microscope. An 8 μM di-4-ANEPPS solution was prepared in pre-warmed DMEM/F12. The CMC medium was replaced by 500 μl of the potentiometric dye solution and incubated for 10 min under culture conditions. The di-4-ANEPPS solution was aspirated, and 500 μl of DMEM/F12 was added. The cells were positioned under the MiCAM ULTIMA-L camera. Optical voltage mapping was conducted by focusing on the MiCAM ULTIMA-L camera. The functional homogeneity was examined by electrical point stimulation at a frequency of 1 Hz utilizing 10-ms rectangular pulses of 8 V. The cultures were paced at a frequency of 1 Hz while recording and 10-ms blue light pulses were used at the utmost current accepted by the LED (i.e., 700 mA). Optogenetics techniques presented a new approach to exploring the modification of the electrophysiological properties of cardiac muscle cells with outstanding spatiotemporal resolution and quantitative control. Light-activated iontophoretic proteins may turn out to be very useful to achieve further insight into the technique underlying cardiac arrhythmias.
Kianianmomeni, A. (2016). Optogenetics Methods and Protocols. New York: Humana Press.
Let's work together!
Have questions? Ask anything!
Monday – Friday
9 AM – 5 PM EST
DISCLAIMER: ConductScience and affiliate products are NOT designed for human consumption, testing, or clinical utilization. They are designed for pre-clinical utilization only. Customers purchasing apparatus for the purposes of scientific research or veterinary care affirm adherence to applicable regulatory bodies for the country in which their research or care is conducted.