Learning Index in the Zebrafish Visual Water Maze
Learn More about our Services and how can we help you with your research!
- Introduction
- Why it Matters?
- Measures
- Applications
- Behavioral Signatures
- Best Practices
- Conclusion
- References
What Is the Learning Index?
The Learning Index is a calculated score that combines multiple performance variables—most often escape latency (time to reach the goal) and path efficiency (how directly the subject moves toward the goal). Some variations may also include trajectory classification, platform crossings, or heading error (Cleal & Parker, 2018; Lucon-Xiccato & Bisazza, 2017).
Its purpose is to quantify learning over time, rather than performance in a single trial. Instead of relying on snapshots, it captures how performance improves—or fails to improve—across repeated exposures.
General formula (conceptual example):

When combined with path efficiency:
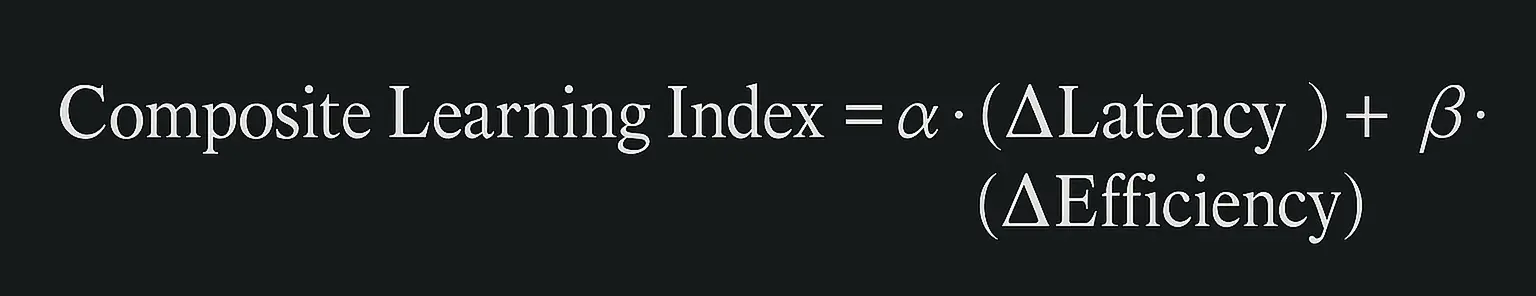
Where α and β are weights reflecting the emphasis placed on time vs. path quality.
A higher Learning Index reflects faster learning, improved navigational strategy, and better task engagement. A flat or declining index may suggest cognitive inflexibility, memory impairment, or lack of motivation.
Why the Learning Index Matters in Zebrafish Research
The Learning Index holds critical importance in zebrafish behavioral neuroscience because it moves beyond static performance metrics to capture the dynamic process of learning itself. While single measures such as escape latency or path length offer snapshots of behavior, they don’t tell the full story. A fish might reach the platform quickly in one trial due to chance, or swim efficiently on one occasion without ever consolidating spatial memory. The Learning Index, by contrast, evaluates how behavior evolves across multiple trials, giving researchers a trajectory of cognitive engagement.
In zebrafish studies, especially those conducted in the Visual Water Maze, this distinction is crucial. The Learning Index accounts for consistency, directionality, and improvement over time, providing a more nuanced and reliable readout of learning acquisition and retention. It helps distinguish animals that are actually learning the spatial task from those exhibiting transient success or stress-driven randomness. This becomes especially important in intervention studies, where changes in learning rate, rather than single-trial outcomes, reflect the efficacy or toxicity of a treatment.
Furthermore, zebrafish are highly sensitive to environmental cues and internal states like anxiety or arousal, which can confound raw performance data. The Learning Index mitigates this by averaging performance across time and emphasizing reliable behavioral trends. For example, a fish that shows fluctuating escape latencies due to initial stress but gradually stabilizes with repeated exposure will demonstrate a positive learning curve, reinforcing the interpretation of cognitive adaptation rather than noise.
This metric is particularly powerful in studies involving genetic mutations, pharmacological treatments, or developmental exposures, where subtle impairments in learning may be masked in individual trials but become clear when viewed as part of a longitudinal pattern. In these contexts, the Learning Index acts as a sensitive barometer of spatial learning and memory integrity, enabling researchers to detect impairments or enhancements that might otherwise go unnoticed.
In summary, the Learning Index matters in zebrafish research because it offers a composite, time-based, and behaviorally rich measure of cognitive performance. It captures not just what a fish does in a given moment, but how it learns, adapts, and remembers over time—a central concern for any study aiming to understand the neural basis of cognition.
Measuring the Learning Index in the Visual Water Maze
Quantifying Learning Progress with Precision and Practical Insight
Accurate measurement of the Learning Index in zebrafish experiments is essential for assessing cognitive function over time. In Conduct Science’s Visual Water Maze, this index is derived by tracking performance across sequential trials—calculating improvements in escape behavior that reflect learning acquisition, spatial memory consolidation, and strategic navigation. Rather than relying on single-point metrics like escape latency alone, the Learning Index offers a composite behavioral score that captures how well a zebrafish internalizes and uses spatial information over repeated exposures to the maze.
Step 1: Define Core Performance Metrics
To calculate the Learning Index, begin by defining the two primary components:
- Escape Latency – The time it takes to reach the platform
- Path Efficiency – The ratio of the shortest possible path to the actual path taken
Optional modifiers include platform crossings, trajectory complexity, or heading error, depending on experimental design.
A common approach is to combine latency and path efficiency into a composite index. For example:
Or, a weighted composite:
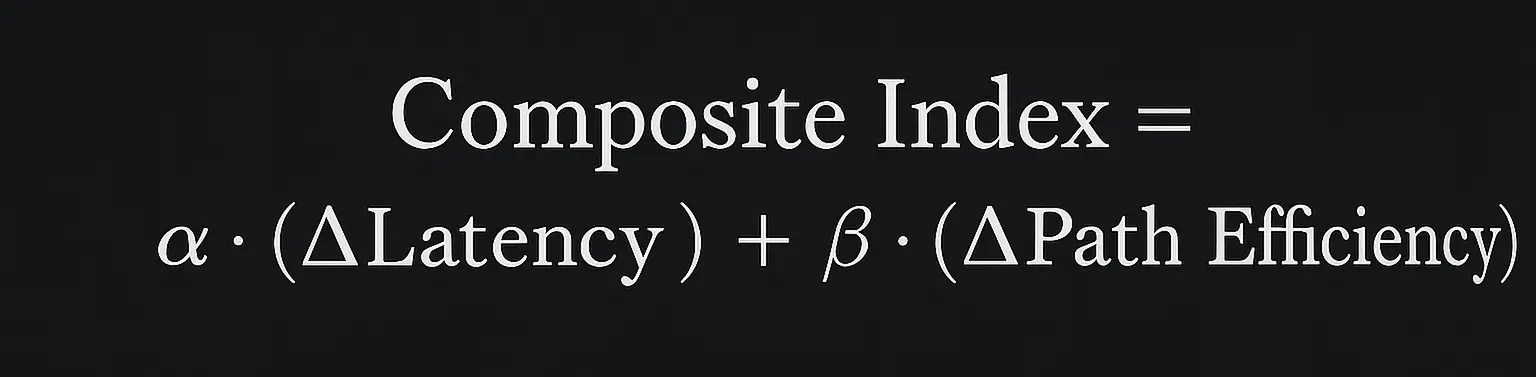
Where α and β weight the contributions of speed and accuracy, respectively.
Step 2: Track Behavior Over Multiple Trials
Using the Visual Water Maze system, Conduct Science provides a fully integrated setup with automated video tracking, virtual zone mapping, and real-time behavioral logging. During training sessions:
- Zebrafish are recorded trial-by-trial
- Escape metrics are stored in the data logger
- Swim trajectories are captured in high resolution
Each of these trials contributes to a temporal map of the animal’s behavior. Researchers can then quantify performance progression across trials, comparing early-stage behavior with later sessions to calculate learning efficiency.
➡️ Visual Reference: In Conduct Science’s YouTube video “Zebrafish Behavioral Testing – Water Maze Demonstration”, you can observe how zebrafish shift from perimeter exploration (indicative of anxiety and low task engagement) to central, goal-oriented navigation after multiple training trials. This behavioral transition is exactly what the Learning Index aims to quantify.
Step 3: Analyze and Visualize Learning Trends
Once data are collected:
- Calculate average escape latency and path efficiency for the first and last sets of trials
- Normalize these values across fish for between-group comparisons
- Visualize the data as learning curves, plotting trial number vs. latency or efficiency
- Use trajectory heatmaps to show the evolution from random exploration to direct navigation
The Learning Index can then be compared across experimental groups (e.g., control vs. drug-treated), or used as a covariate in broader behavioral phenotyping.
➡️ Practical Tip from Conduct Science’s Channel: In the clip on “Visual Maze Strategies for Zebrafish”, swim paths are overlaid with time-color gradients. This visualization technique is invaluable for validating Learning Index trends. You can clearly see if the fish’s improvement is due to memory or simply increased motor activity.
Step 4: Normalize for Confounds and Interpret
Ensure consistency across:
- Trial durations
- Tank layout and cue visibility
- Start positions
Additionally, track swim speed and thigmotaxis, both of which can skew latency without reflecting memory. A zebrafish with reduced latency but erratic or wall-hugging behavior may not be showing true learning. Conversely, a steady trajectory with minor latency improvement could still represent cognitive progress.
Include these supporting variables in your interpretation of the Learning Index:
- High Learning Index + High Path Efficiency → Robust spatial memory
- Low Learning Index + Preserved Swim Speed → Likely cognitive impairment
- Flat Learning Index + High Thigmotaxis → Anxiety-driven task disengagement
The Learning Index, when calculated from high-resolution behavioral tracking and interpreted in the context of complementary metrics, offers a powerful, consolidated measure of zebrafish cognition. Conduct Science’s Visual Water Maze platform provides the tools needed for rigorous, repeatable calculation of this metric—including trial sequencing, virtual zone mapping, and video export functions for review.
By referencing visual demonstrations from the Conduct Science YouTube channel, researchers can align their observational insights with quantitative data. These resources not only reinforce proper methodology but also help standardize interpretation across labs.
Ultimately, the Learning Index enables researchers to transform swim paths into learning curves, turning raw behavior into rich cognitive data.
Applications in Neurobehavioral and Cognitive Research
Leveraging the Learning Index to Decode Brain Function in Zebrafish Models
The Learning Index is more than a convenience metric—it’s a critical analytical tool in neurobehavioral science that enables researchers to track cognitive progress over time. In zebrafish models, it captures learning dynamics that are often too subtle to be reflected in single-point measures like escape latency or platform crossings. This makes it particularly useful for exploring the effects of genetic alterations, pharmacological interventions, and environmental exposures on brain function.
1. Drug Testing and Cognitive Modulation
In pharmacological studies, the Learning Index plays a central role in assessing how drugs enhance or impair learning and memory. Cognitive enhancers such as donepezil, nicotine, or serotonergic agents have been shown to improve spatial task performance in zebrafish (Cleal et al., 2020; Parker et al., 2013).
For example, zebrafish treated with donepezil often show:
- Faster decreases in escape latency
- Improved path efficiency
- Sharper Learning Index curves
The Learning Index helps quantify these drug-induced improvements early in the training period, before other metrics become significantly different. Conversely, when animals are exposed to anxiogenic or sedative compounds, a flattened or declining Learning Index may reveal impaired task engagement or cognitive suppression.
Application: The Learning Index supports dose-response analysis, onset duration tracking, and post-treatment recovery assessments, making it a robust tool for cognitive drug profiling.
2. Genetic Models of Cognitive Impairment
Zebrafish are increasingly used to model neurodevelopmental and neurodegenerative disorders. Mutations in genes such as appb, psen1 (Alzheimer’s-related), or shank3b and cntnap2 (autism spectrum disorder-related) often result in cognitive phenotypes detectable in maze performance.
In such models, zebrafish frequently show:
- Little or no reduction in escape latency over trials
- Chaotic or inefficient swim paths
- Low or flat Learning Index scores despite intact swim speed
These patterns point to specific deficits in learning acquisition, memory consolidation, or executive function, rather than motor impairments.
For example, in a study by Newman et al. (2014), zebrafish with psen1 mutations exhibited impaired learning trajectories in spatial tasks—reflected in significantly lower Learning Index scores compared to controls. Similarly, in autism-related models, disrupted Learning Index curves can reveal cognitive rigidity, an inability to adapt strategy over trials, or poor response to spatial cues (Tang et al., 2020).
Application: The Learning Index provides a quantitative cognitive fingerprint for assessing the severity and nature of neurological deficits in transgenic or mutant zebrafish lines.
3. Environmental and Developmental Toxicology
One of the most compelling uses of the Learning Index is in the detection of subtle cognitive impairments caused by environmental exposures. Zebrafish embryos and larvae are frequently used in regulatory and toxicology research to evaluate compounds such as:
- Organophosphates (e.g., chlorpyrifos)
- Endocrine disruptors (e.g., BPA, phthalates)
- Heavy metals (e.g., lead, mercury)
In these studies, early-life exposure may not cause visible deformities or gross motor impairments, but learning capacity is often compromised. A fish may swim normally and exhibit typical exploratory behavior, yet fail to improve over successive trials—a pattern that is precisely captured by the Learning Index (Eddins et al., 2010).
Application: This metric acts as a behavioral biomarker of neurotoxicity, supporting risk assessment protocols and revealing functional impairments that might not be evident through morphology alone.
4. Aging and Cognitive Decline
Zebrafish are now established as a model organism for studying age-related memory decline. As they age, zebrafish demonstrate a reduction in:
- Task acquisition speed
- Spatial recall accuracy
- Exploratory efficiency
These changes are often reflected in blunted Learning Index curves, with older fish showing slower or less consistent improvements across training sessions. Notably, such declines may occur independently of swim speed or motor activity, supporting the idea that the Learning Index isolates true cognitive deterioration.
Application: The Learning Index serves as a non-invasive, quantifiable measure of cognitive aging, useful in lifespan studies and for evaluating interventions aimed at preserving memory function over time.
5. Stress, Anxiety, and Affective Neuroscience
Though primarily cognitive, the Learning Index is sensitive to the emotional and motivational state of the zebrafish. Chronic stress, elevated anxiety, or depressive-like behaviors can interfere with goal-directed learning—leading to flat learning curves even in physically healthy fish.
When used in conjunction with thigmotaxis (wall-hugging), freezing time, and erratic swimming analysis, the Learning Index helps differentiate cognitive failure from emotional avoidance.
Application: This combination of behavioral metrics enables researchers to deconvolve the impact of mood disorders on memory systems, opening the door to affective-cognitive interaction studies in zebrafish.
Across disciplines—from drug discovery to toxicology and neuroscience—the Learning Index offers a powerful, multi-trial metric of learning and cognitive flexibility. It reveals whether a zebrafish adapts, improves, and remembers, rather than simply performing or reacting.
By integrating escape latency, path quality, and trial consistency, the Learning Index becomes an indispensable tool for profiling cognitive health, resilience, and dysfunction in a wide range of zebrafish models. When used thoughtfully, it transforms raw swim paths into high-resolution maps of brain function—making the invisible architecture of memory measurable, interpretable, and scientifically actionable.
Interpreting the Learning Index: Behavioral Signatures
|
Learning Index Pattern |
Interpretation |
|
Rising steadily |
Successful learning and memory consolidation |
|
Early spike, plateau later |
Quick acquisition but limited flexibility |
|
Flat trend |
Cognitive rigidity or impaired encoding |
|
Decline |
Stress, fatigue, or side effects from intervention |
These patterns can be aligned with trajectory plots, platform crossing data, and heatmaps to form a comprehensive behavioral profile.
Best Practices for Analysis and Reporting
- Clearly state the calculation method used for the Learning Index
- Present learning curves for individuals and group averages
- Ensure equal trial counts across subjects
- Use ANOVA or mixed-effects modeling to assess learning differences
- Report any exclusions or anomalies (e.g., freezing, outlier latency)
Providing detailed methodological information ensures that your Learning Index data is transparent, interpretable, and reproducible.
Conclusion: A Cognitive Signature in a Single Score
The Learning Index in the Visual Water Maze is more than a number—it is a signature of cognitive adaptation. It captures the rhythm of learning, the sharpening of strategy, and the retention of spatial knowledge over time. Whether you’re modeling disease, testing interventions, or evaluating developmental toxicity, this composite measure helps transform behavioral trajectories into scientific insight.
With careful design and rigorous analysis, the Learning Index becomes an indispensable tool for quantifying cognitive performance in zebrafish—bringing clarity, precision, and meaning to behavioral neuroscience.
References
- Cleal, M., Fontana, B. D., & Parker, M. O. (2020). Zebrafish as a model to investigate the effects of pharmacological modulation of the serotonin system on cognitive function. Psychopharmacology, 237(10), 2951–2967. https://doi.org/10.1007/s00213-020-05596-4
- Cleal, M., & Parker, M. O. (2018). Moderate developmental alcohol exposure reduces repetitive alternation in a zebrafish model of fetal alcohol spectrum disorders. Neurotoxicology and Teratology, 65, 46–53. https://doi.org/10.1016/j.ntt.2018.01.003
- Gerlai, R. (2020). Evolutionary conservation, translational relevance and cognitive function: The future of zebrafish in behavioral neuroscience. Neuroscience & Biobehavioral Reviews, 116, 426–435. https://doi.org/10.1016/j.neubiorev.2020.07.017
- Newman, M., Ebrahimie, E., & Lardelli, M. (2014). Using the zebrafish model for Alzheimer’s disease research. Frontiers in Genetics, 5, 189. https://doi.org/10.3389/fgene.2014.00189
- Tang, W., et al. (2020). Modeling autism spectrum disorder in zebrafish: A behavioral and neuropharmacological perspective. Neuropharmacology, 171, 108082. https://doi.org/10.1016/j.neuropharm.2020.108082
- Eddins, D., Cerutti, D., Williams, P., Linney, E., & Levin, E. D. (2010). Zebrafish provide a sensitive model of persisting neurobehavioral effects of developmental chlorpyrifos exposure. Neurotoxicology and Teratology, 32(1), 99–105. https://doi.org/10.1016/j.ntt.2009.04.070
- Parker, M. O., Brock, A. J., Sudwarts, A., & Brennan, C. H. (2013). Atomoxetine reduces anticipatory responding in a 5-choice serial reaction time task for adult zebrafish. Psychopharmacology, 231, 2671–2679. https://doi.org/10.1007/s00213-013-3423-5
Written by researchers, for researchers — powered by Conduct Science.