x
[quotes_form]

Maze Bazics: Sucrose Preference Test

Learn More about our Services and how can we help you with your research!

Introduction

The sucrose preference test (SPT) is a widely used behavioral assay in neuroscience and psychology research, particularly for assessing anhedonia in rodent models. Anhedonia, the reduced ability to experience pleasure, is a core symptom of major depressive disorder and other psychiatric conditions. The SPT is favored for its simplicity, non-invasiveness, and ability to provide insight into the affective state of animals.

Animals are given access to two drinking solutions, either in their home cage or within an experimental setup. One solution contains sucrose (or sometimes another sweetener), and the other is plain water. The preference is determined by measuring the total intake of each liquid, with animals typically showing a preference for one solution over the other.

Disorders of reward behavior lead to a reduced liking for sweet drinks, shown by drinking less of them. In line with this, a reduced sucrose preference has been linked to various other depression indicators, including learned helplessness [1] and performance in the light/dark box test [2].

Methodology of the Sucrose Preference Test

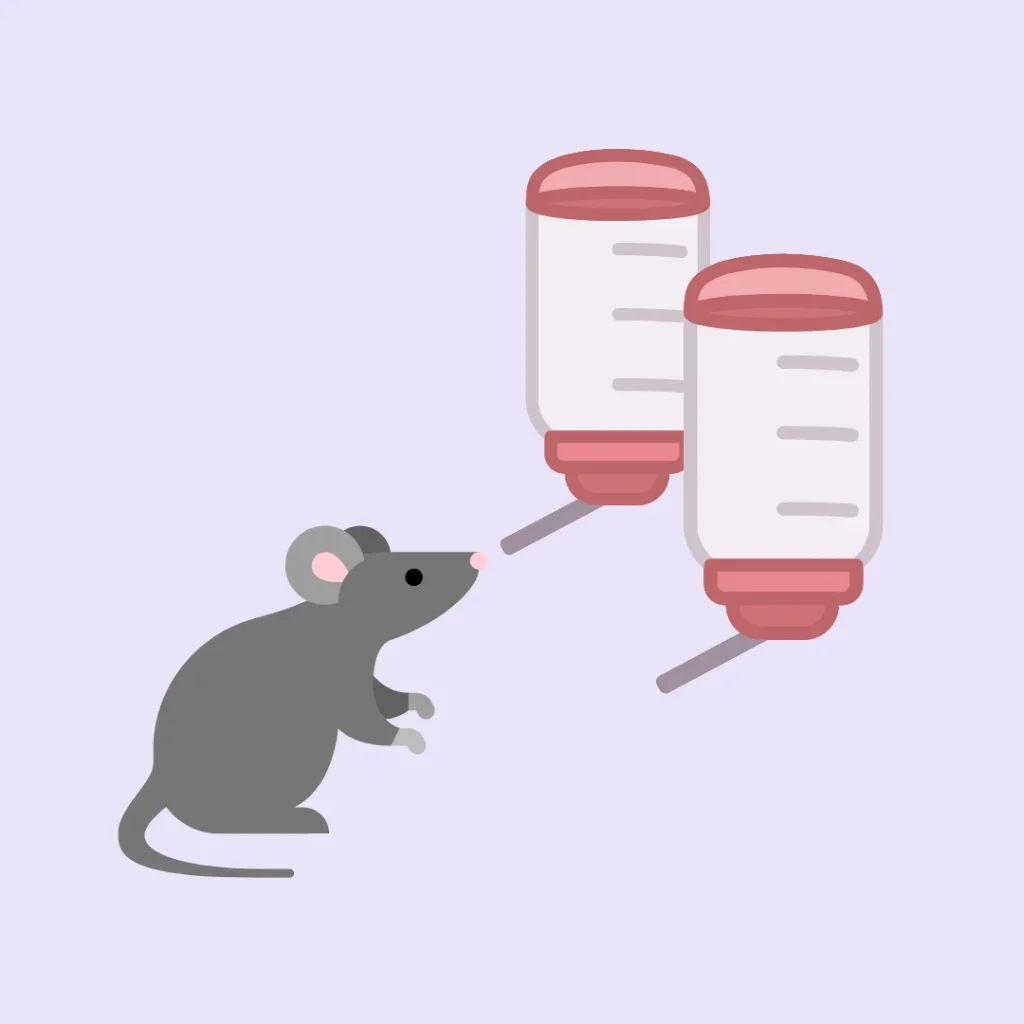
As already mentioned, the SPT involves providing rodents with two bottles, one containing a sucrose solution and the other containing plain water, typically over a 24-hour period. The preference for the sucrose solution over water is measured as an indicator of the animal’s hedonic drive. A decrease in sucrose preference is interpreted as an indicator of anhedonia. [3]

Preparation: Animals are habituated to the testing environment and trained to drink from two identical bottles to ensure they do not develop a side preference.

  1. Testing: The animals are then given access to both bottles, one with a sucrose solution (usually 1-2% sucrose dissolved in either distilled water or standard drinking water) and the other with plain water. The position of the bottles is alternated regularly to prevent side bias.
  2. Measurement: The amount of liquid consumed from each bottle is measured. Sucrose preference is calculated as the volume of sucrose solution consumed divided by the total volume of liquid consumed from both bottles. [4]


Sucrose preference can be assessed over a full 24-hour period or during a specific time frame. When choosing a specific time frame, consistency across all animals is crucial due to the influence of nocturnal rhythms on preference behavior. [5] 

The results can be calculated in various ways, such as the total milliliters of solution consumed (expressed as a ratio of sweetened to unsweetened solution) or the grams of sucrose consumed per gram of body weight. Although these two measurements typically correlate in animal models, the latter can offer additional insights into disordered eating behaviors or weight loss linked to stress and anxiety.

For the sucrose preference test to yield accurate results, it is essential that mice or rats are housed individually in separate cages. This approach allows for the distinction of individual animal preferences, which cannot be accurately measured if the animals are group-housed. Typically, animals that were previously housed in groups require an adaptation period of 48-72 hours to acclimate to individual housing conditions.

Some researchers argue that sucrose may not be the ideal sweetener for the sucrose preference test due to its caloric content, which might reflect a preference for a caloric liquid over a non-caloric one, rather than a pleasurable versus neutral stimulus. 

However, this concern has been challenged by studies showing no significant difference in sucrose preference between food-deprived and non-deprived rats. [6] 

To address this variable, non-caloric sweeteners are often used. Saccharin, typically at a concentration of 0.1% due to its higher sweetness compared to sucrose, is a common alternative. Studies have shown no difference in consumption between saccharin and sucrose in both naïve animals and depression models, such as those subjected to chronic mild stress. [7]

Strain and Sex Differences

As with many experimental procedures, differences in sucrose preference are observed among various strains of mice and rats. For example, Lister hooded rats show a significant preference for a 1% sucrose solution, whereas Wistar rats do not. In the case of Wistar rats, the sucrose concentration must be increased to 2% to elicit a preference. [7] 

Similarly, there are mouse strains that exhibit lower sensitivity to sucrose. According to study, 129P3/J mice show a lower preference for sucrose- or maltodextrin-sweetened solutions compared to the commonly used C57BL/6J mice. [8]

In addition to strain differences, researchers have observed sex differences in sucrose preference among rodents. For example, male Wistar Kyoto rats display lower sucrose preference compared to female Wistar Kyoto rats. In contrast, no such sex difference is observed in Sprague-Dawley rats, which show equal levels of sucrose preference between males and females. Interestingly, these sex differences extend to stress-induced reductions in sucrose preference. Male Kyoto Wistar rats exhibit a stress-induced decrease in sucrose preference, whereas females do not. Conversely, both male and female Sprague-Dawley rats show a reduction in sucrose preference following chronic mild stress.

Applications in Research

  1. Depression Models: The SPT is a cornerstone in preclinical research on depression. Rodents subjected to chronic mild stress, social defeat, or other stress-inducing protocols typically exhibit decreased sucrose preference, mirroring the anhedonic symptoms seen in human depression [9].
  2. Neurobiological Studies: The test aids in elucidating the neural circuits and neurotransmitter systems involved in reward processing. For example, alterations in dopaminergic pathways are often associated with changes in sucrose preference [10].
  3. Pharmacological Testing: The SPT is used to screen potential antidepressant compounds. An increase in sucrose preference following drug administration suggests potential antidepressant effects [11].

Conclusion

The Sucrose Preference Test (SPT) is especially valuable in studies focused on the neurobiology of depression and the effectiveness of antidepressant treatments. By comparing sucrose preference between control and experimental groups, researchers can assess the impact of various treatments or genetic modifications on anhedonia. For example, chronic stress models typically exhibit reduced sucrose preference, which can be restored with antidepressant treatment, thus validating both the model and the treatment’s efficacy.

The test remains a critical tool in behavioral neuroscience, offering essential insights into the mechanisms underlying anhedonia and the effectiveness of antidepressant therapies. Its straightforward methodology and relevance to human psychiatric conditions make it an indispensable component of preclinical research.

References

  1. Sanchi-Segura. C., Spanagel R., Henn, F.A., Vollmayr, G. (2005) Reduced sensitivity to sucrose in rats bred for helplessness: a study using the matching law. Behav. Pharmacol. 16, 267–270.
  2. Alkhlaif, Y., Bagdas, D., Jackson, A., Park, A. J., & Damaj, M. I. (2017). Assessment of nicotine withdrawal-induced changes in sucrose preference in mice. Pharmacology, Biochemistry, and Behavior, 161, 47–52.
  3. Willner, P., et al. (1987). “Chronic mild unpredictable stress: A model of depression in rats.” Journal of Neuroscience Methods, 22(3), 269-287
  4. Papp, M., et al. (1991). “An animal model of anhedonia: Attenuation of sucrose consumption and preference following chronic unpredictable mild stress.” Psychopharmacology, 104(2), 255-259.
  5. Muscat, R., & Willner, P. (1992). Suppression of sucrose drinking by chronic mild unpredictable stress: a methodological analysis. Neuroscience and Biobehavioral Reviews, 16(4), 507–517
  6. Willner, P. (1997). Validity, reliability and utility of the chronic mild stress model of depression: a 10-year review and evaluation. Psychopharmacology, 134(4), 319–329
  7. Ackroff, K., & Sclafani, A. (2016). Maltodextrin and Sucrose Preferences in Sweet-Sensitive (C57BL/6J) and Subsensitive (129P3/J) Mice Revisited. Physiology & Behavior, 165, 286–290
  8. Burke, N. N., Coppinger, J., Deaver, D. R., Roche, M., Finn, D. P., & Kelly, J. (2016). Sex differences and similarities in depressive- and anxiety-like behaviour in the Wistar-Kyoto rat. Physiology & Behavior, 167, 28–34.
  9. Cryan, J. F., & Mombereau, C. (2004). “In search of a depressed mouse: Utility of models for studying depression-related behavior in genetically modified mice.” Molecular Psychiatry, 9(4), 326-357.
  10. Nestler, E. J., & Carlezon, W. A. Jr. (2006). “The mesolimbic dopamine reward circuit in depression.” Biological Psychiatry, 59(12), 1151-1159.
  11. Overstreet, D. H. (1993). “The Flinders sensitive line rats: A genetic animal model of depression.” Neuroscience & Biobehavioral Reviews, 17(1), 51-68.

See more of Our Posts

COMPREHENSIVE BEHAVIORAL NEUROSCIENCE CATEGORY

All Resources

Never miss our posts!

Author:

Vanja Antonijevic

Vanja works as the Social Media and Academic Program Manager at Conduct Science. With a Bachelor’s degree in Molecular Biology and Physiology and a Master’s degree in Human Molecular Biology, Vanja is dedicated to sharing scientific knowledge on social media platforms. Additionally, Vanja provides direct support to the editorial board at Conduct Science Academic Publishing House.