

The electron transport chain (ETC) is a group of protein complexes that function in the last stage of cellular respiration.
In eukaryotes, the electron transport chain is found in the inner mitochondrial membrane where each component acts in sequence to catalyze redox reactions, transfer electrons from their donor to acceptor molecules, and simultaneously transport protons (H+) across the inner mitochondrial membrane to the intermembrane space.
This process of transferring electrons via the ETC regenerates nicotinamide adenine dinucleotide (NAD+) and flavin adenine dinucleotide (FAD+) to resupply the metabolic pool.
Moreover, the transfer of protons across the membrane also establishes the proton gradients which provide energy for oxidative phosphorylation that synthesizes adenosine triphosphate (ATP) for cellular use.
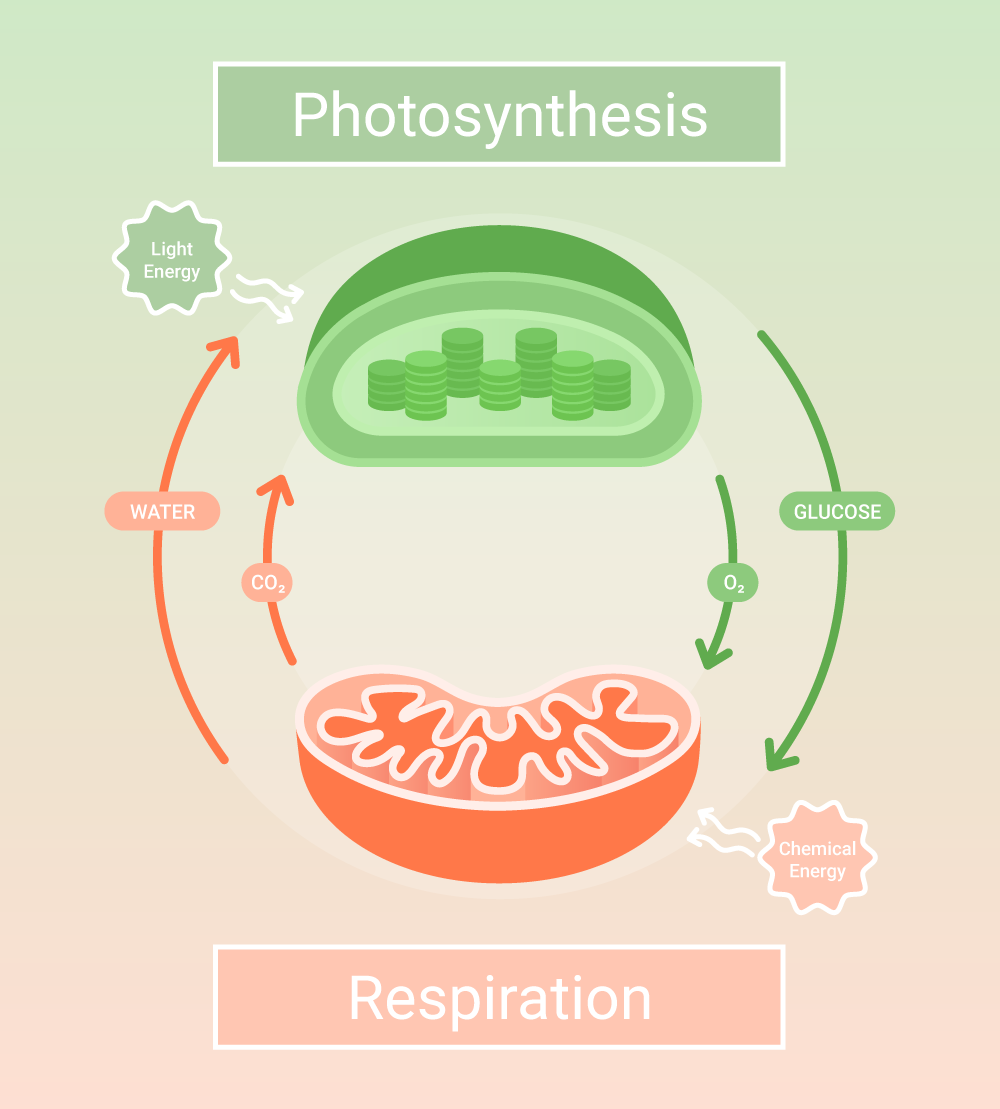
Cellular respiration is a cellular catabolic process that harvests potential energy from chemical bonds of carbohydrate molecules in the form of ATP. The complete cellular process consists of four pathways: glycolysis, pyruvate oxidation, the Krebs cycle, and oxidative phosphorylation.
When a glucose molecule enters glycolysis, it is transformed into two pyruvate molecules. With sufficient oxygen level, each pyruvate molecule is transported to the mitochondrial matrix where it is oxidized and transformed into acetyl coenzyme A (acetyl-CoA), which undergoes a series of enzymatic reactions in the Krebs cycle.
At the end of the first three cellular respiration pathways, FAD+ and NAD+ are reduced into NADH and FADH2, and ATP is generated from substrate-level phosphorylation. Though the amount of ATP generated is substantial, it is insufficient for all cellular activities. Thus, most ATP molecules are synthesized during the last stage of cellular respiration from oxidative phosphorylation.[1]
In oxidative phosphorylation, ATP is synthesized by chemiosmosis. It is connected with redox reactions, where electrons are transferred in the final stage of cellular respiration. It is mediated by a group of protein complexes in the inner mitochondrial membrane called the electron transport chain.
The electron transport chain receives electrons from NADH and FADH2 in the mitochondrial matrix, which results from the previous stages of cellular respiration. NADH and FADH2 are oxidized into NAD+ and FAD+, while the proteins in the electron transport chain are reduced.
To return to their normal state, the reduced electron transport proteins donate the electrons to the next electron carriers in the electron transport chain. Eventually, the electrons are donated to oxygen, which is the final electron acceptor in the oxidation-reduction reactions of cellular respiration. The resulting NAD+ and FAD+ are recycled to supply other pathways.[1]
The oxidation of NADH and FADH2 by the electron transport chain is coupled with chemiosmosis. During electron transfer, proteins in the electron transport chain complexes pump the protons in the mitochondrial matrix to the intermembrane space.
The accumulated protons in the intermembrane space generate proton gradients across the inner mitochondrial membrane. Since the protons are positively charged, proton gradients create an electrochemical (pH and charge) difference, which generates an electrochemical potential.
The electrochemical potential serves as a proton motive force that drives the transport of protons down the concentration gradients through ATP synthase, which situates in the inner mitochondrial membrane. The transport of protons to the matrix through ATP synthase phosphorylates ADP and synthesizes ATP in the process.
Thus, the electron transport chain establishes the proton gradients during electron transport, i.e. NADH and FADH2 oxidation. In turn, the resulting proton gradients drive the synthesis of ATP during oxidative phosphorylation.[1,2]
Also, pumping of proton by ATP synthase causes a conformational change in the protein. The protein (ATP synthase) is like a wheel and axle. So when proton is pumped through it, the coupling of ADP and inorganic phosphate occurs to yield ATP.
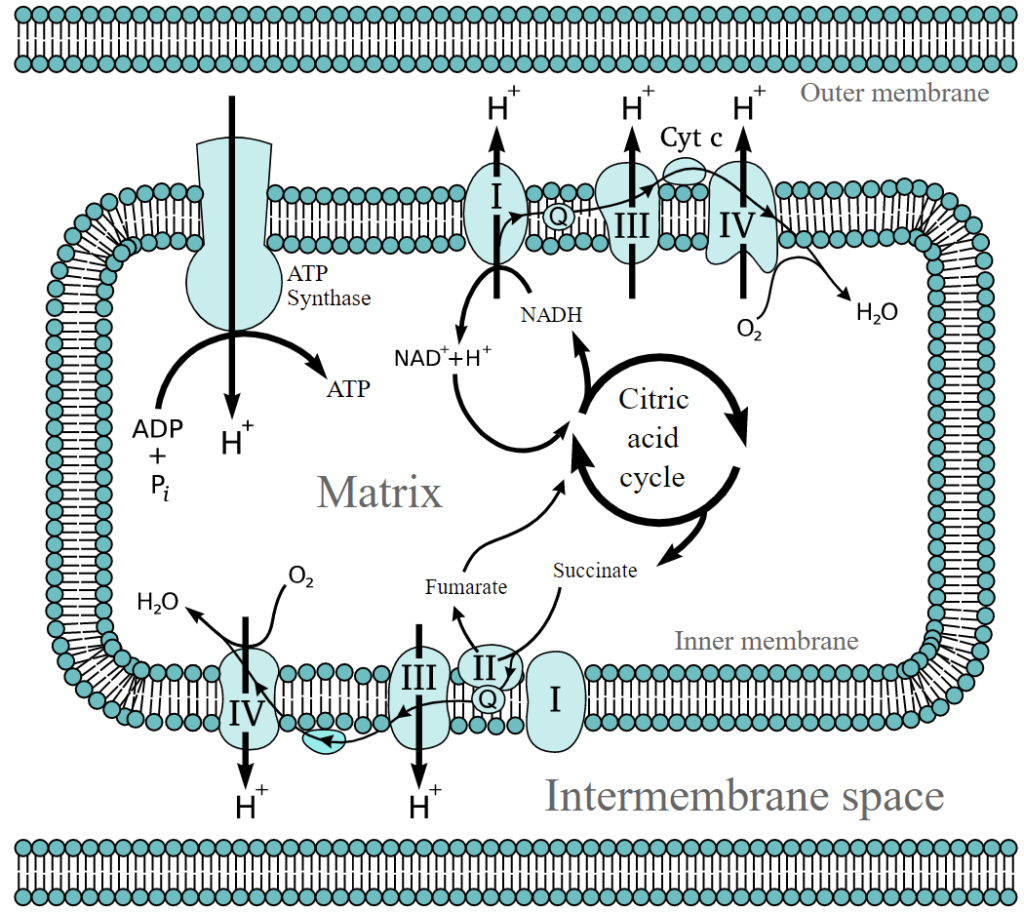
Figure 1: Electron Transport Chain and the enzyme ATP synthase.
Credit: By Fvasconcellos 22:35, 9 September 2007 (UTC) – Vector version of w:Image:Etc4.png by TimVickers, content unchanged., Public Domain, https://commons.wikimedia.org/w/index.php?curid=2716553
The electron transport chain can be divided into 4 key processes which are:
The electron transport chain consists of four multisubunit protein complexes located in the inner mitochondrial membrane. The proteins in each complex oxidize NADH and/or FADH2 and carry the electrons to the next acceptors. As the name implies, the electrons travel through a sequence of proteins in the electron transport chain until they are donated to oxygen, reducing it to water.
The protein complexes that make up the electron transport chain are:[1,2]
Also known as ubiquinone oxidoreductase, Complex I of the electron transport chain comprises of NADH dehydrogenase, flavin mononucleotide (FMN), eight iron-sulfur clusters (Fe-S), and coenzyme Q (CoQ).[3]
NADH from earlier cellular respiration stages donates two electrons to FMN. Each electron donated to FMN is transferred to the Fe-S, which is transferred to CoQ.
The fully oxidized form of CoQ is also known as ubiquinone (UQ). UQ can be reduced to ubisemiquinone (UQH) when receiving one electron and to ubiquinol (UQH2) when receiving a second electron. Subsequently, reduced UQ, UQH, or UQH2 transfer electrons to Complex III of the electron transport chain.
During electron transport in Complex I, four (4) protons are simultaneously transported from the mitochondrial matrix to the intermembrane space, setting the electrochemical gradients that drive ATP synthesis in oxidative phosphorylation.[1-3]
Moreover, the change in redox state of the protein in complex I causes a conformational change which drives pumping of protons across the inner mitochondrial membrane.
NADH + UQ + 5H –> NAD+ + UQH2 + 4H+
Most enzymes in Complex II of the electron transport chain are similar to the ones found in Complex I. However, unlike Complex I, electron transport in Complex II is not coupled with the transport of protons from the inner mitochondrial membrane to the intermembrane space.
Another major difference is Complex II’s direct connection to the Krebs cycle and, in certain cells, β-oxidation, a pathway that breaks down fatty acids into acetyl CoA.[1]
In Complex II, the enzyme succinate dehydrogenase in the inner mitochondrial membrane reduce FADH2 to FAD+. Simultaneously, succinate, an intermediate in the Krebs cycle, is oxidized to fumarate. Fumarate returns to the mitochondrial matrix, where it re-enters the Krebs cycle and undergoes a series of enzymatic reactions.
Similar to the electron flow in Complex I, the electrons from the oxidation of FADH2 are passed to Fe-S and subsequently to CoQ, reducing it to UQH and UQH2, respectively. Eventually, electrons carried by UQH2 are sent to Complex III.
Unlike Complex I, the protons in Complex II are not transported to the intermembrane space during electron transport. Thus, Complex II’s contribution to ATP synthesized from oxidative phosphorylation is considerably less than other complexes.[1,2]
Complex III of the electron transport chain consists of cytochrome b and cytochrome c1 complexes, which contain a two-iron two-sulfur cluster (2Fe-2S) called the Rieske center and a heme prosthetic group.[2-3]
Electrons that enter Complex III are carried by UQH2 from Complex I or II to Complex III. Since UQH2 carries two electrons, while the heme prosthetic group in either cytochrome can accommodate only one electron at a time, the transfer of electrons in Complex III occurs in a series of redox reactions called the Q cycle.
The Q cycle starts when the first UQH2 enters Complex III and binds to the Rieske center. There, UQH2 is oxidized into UQH, donating one electron to cytochrome c1. Subsequently, UQH is oxidized into CoQ/UQ when it donates another electron to cytochrome b.
The reduced cytochrome c1 carries the accepted electron to cytochrome c, which brings the electron to Complex IV, the last complex of the electron transport chain. In cases of reduced cytochrome b, the electron is transferred from cytochrome b to CoQ on the other side of the complex, replenishing UQH in the process.
Finally, UQH is further reduced to UQH2 when it accepts another electron from the next cytochrome b that is reduced by the second UQH2 that enters Complex III.
As a result, when two UQH2 enter Complex III, four electrons move through the Q cycle in Complex III, and one UQH2 is regenerated. Two electrons are carried to Complex IV by cytochrome c, and two electrons are used to regenerate UQH2.
Concurrently, one proton is transferred across to the intermembrane space each time an electron is donated to cytochrome c1 or from cytochrome b. Thus, four protons are pumped into the intermembrane space in one Q-cycle, adding to proton gradients across the inner mitochondrial membrane.[1-3]
In summary:
UQH2 + 2Cytc + 2H+ –> UQ + 2Cytc + 4H+
The last complex in the electron transport chain receives electrons from Complex III and transfers them to oxygen, the final electron acceptor in cellular respiration.
Complex IV consists of cytochrome a, cytochrome a3, a copper atom CuB, and a copper atom pair CuA center, which can accommodate four electrons, acting as a redox center.[2-3]
One oxygen molecule can accept four electrons. For this reason, four cytochrome c, each carrying one electron from Complex III, are required to reduce one oxygen molecule into two water molecules.
Similar to Complex I and III, two protons (for every two cytochrome c that is oxidized) from the matrix are transported across the inner mitochondrial membrane to the intermembrane space during electron transport.[3]
2Cytc + ½O2 + 4H+ –> 2Cytc + H2O + 2H+
The accumulation of protons builds on the existing proton gradients that occur during electron transport in Complex I and III. The proton gradients add to the existing electrochemical potential, which provide the proton motive force that drives ATP synthesis in oxidative phosphorylation.
It is estimated that the complete oxidation of one NADH molecule would result in three molecules of synthesized ATP, while the complete oxidation of one FADH2 molecule will yield two molecules of synthesized ATP.[1-3]
The electron transport chain is a group of protein complexes that facilitate the transfer of electrons in the final stage of cellular respiration. They catalyze redox reactions that resupply the cellular NAD+ and FAD+ pool while setting up the electrochemical potential that is essential for the synthesis of ATP by oxidative phosphorylation.
Malfunctioning electron transport chains can result in depleted energy levels and the formation of radicals such as reactive oxygen species. While this can affect the health and well-being of the cells, the understanding of such disturbances is useful and applicable in agricultural practices and drug designs.
In behavioral neuroscience, the Open Field Test (OFT) remains one of the most widely used assays to evaluate rodent models of affect, cognition, and motivation. It provides a non-invasive framework for examining how animals respond to novelty, stress, and pharmacological or environmental manipulations. Among the test’s core metrics, the percentage of time spent in the center zone offers a uniquely normalized and sensitive measure of an animal’s emotional reactivity and willingness to engage with a potentially risky environment.
This metric is calculated as the proportion of time spent in the central area of the arena—typically the inner 25%—relative to the entire session duration. By normalizing this value, researchers gain a behaviorally informative variable that is resilient to fluctuations in session length or overall movement levels. This makes it especially valuable in comparative analyses, longitudinal monitoring, and cross-model validation.
Unlike raw center duration, which can be affected by trial design inconsistencies, the percentage-based measure enables clearer comparisons across animals, treatments, and conditions. It plays a key role in identifying trait anxiety, avoidance behavior, risk-taking tendencies, and environmental adaptation, making it indispensable in both basic and translational research contexts.
Whereas simple center duration provides absolute time, the percentage-based metric introduces greater interpretability and reproducibility, especially when comparing different animal models, treatment conditions, or experimental setups. It is particularly effective for quantifying avoidance behaviors, risk assessment strategies, and trait anxiety profiles in both acute and longitudinal designs.
This metric reflects the relative amount of time an animal chooses to spend in the open, exposed portion of the arena—typically defined as the inner 25% of a square or circular enclosure. Because rodents innately prefer the periphery (thigmotaxis), time in the center is inversely associated with anxiety-like behavior. As such, this percentage is considered a sensitive, normalized index of:
Critically, because this metric is normalized by session duration, it accommodates variability in activity levels or testing conditions. This makes it especially suitable for comparing across individuals, treatment groups, or timepoints in longitudinal studies.
A high percentage of center time indicates reduced anxiety, increased novelty-seeking, or pharmacological modulation (e.g., anxiolysis). Conversely, a low percentage suggests emotional inhibition, behavioral avoidance, or contextual hypervigilance. reduced anxiety, increased novelty-seeking, or pharmacological modulation (e.g., anxiolysis). Conversely, a low percentage suggests emotional inhibition, behavioral avoidance, or contextual hypervigilance.
The percentage of center time is one of the most direct, unconditioned readouts of anxiety-like behavior in rodents. It is frequently reduced in models of PTSD, chronic stress, or early-life adversity, where animals exhibit persistent avoidance of the center due to heightened emotional reactivity. This metric can also distinguish between acute anxiety responses and enduring trait anxiety, especially in longitudinal or developmental studies. Its normalized nature makes it ideal for comparing across cohorts with variable locomotor profiles, helping researchers detect true affective changes rather than activity-based confounds.
Rodents that spend more time in the center zone typically exhibit broader and more flexible exploration strategies. This behavior reflects not only reduced anxiety but also cognitive engagement and environmental curiosity. High center percentage is associated with robust spatial learning, attentional scanning, and memory encoding functions, supported by coordinated activation in the prefrontal cortex, hippocampus, and basal forebrain. In contrast, reduced center engagement may signal spatial rigidity, attentional narrowing, or cognitive withdrawal, particularly in models of neurodegeneration or aging.
The open field test remains one of the most widely accepted platforms for testing anxiolytic and psychotropic drugs. The percentage of center time reliably increases following administration of anxiolytic agents such as benzodiazepines, SSRIs, and GABA-A receptor agonists. This metric serves as a sensitive and reproducible endpoint in preclinical dose-finding studies, mechanistic pharmacology, and compound screening pipelines. It also aids in differentiating true anxiolytic effects from sedation or motor suppression by integrating with other behavioral parameters like distance traveled and entry count (Prut & Belzung, 2003).
Sex-based differences in emotional regulation often manifest in open field behavior, with female rodents generally exhibiting higher variability in center zone metrics due to hormonal cycling. For example, estrogen has been shown to facilitate exploratory behavior and increase center occupancy, while progesterone and stress-induced corticosterone often reduce it. Studies involving gonadectomy, hormone replacement, or sex-specific genetic knockouts use this metric to quantify the impact of endocrine factors on anxiety and exploratory behavior. As such, it remains a vital tool for dissecting sex-dependent neurobehavioral dynamics.
The percentage of center time is one of the most direct, unconditioned readouts of anxiety-like behavior in rodents. It is frequently reduced in models of PTSD, chronic stress, or early-life adversity. Because it is normalized, this metric is especially helpful for distinguishing between genuine avoidance and low general activity.
Environmental Control: Uniformity in environmental conditions is essential. Lighting should be evenly diffused to avoid shadow bias, and noise should be minimized to prevent stress-induced variability. The arena must be cleaned between trials using odor-neutral solutions to eliminate scent trails or pheromone cues that may affect zone preference. Any variation in these conditions can introduce systematic bias in center zone behavior. Use consistent definitions of the center zone (commonly 25% of total area) to allow valid comparisons. Software-based segmentation enhances spatial precision.
Evaluating how center time evolves across the duration of a session—divided into early, middle, and late thirds—provides insight into behavioral transitions and adaptive responses. Animals may begin by avoiding the center, only to gradually increase center time as they habituate to the environment. Conversely, persistently low center time across the session can signal prolonged anxiety, fear generalization, or a trait-like avoidance phenotype.
To validate the significance of center time percentage, it should be examined alongside results from other anxiety-related tests such as the Elevated Plus Maze, Light-Dark Box, or Novelty Suppressed Feeding. Concordance across paradigms supports the reliability of center time as a trait marker, while discordance may indicate task-specific reactivity or behavioral dissociation.
When paired with high-resolution scoring of behavioral events such as rearing, grooming, defecation, or immobility, center time offers a richer view of the animal’s internal state. For example, an animal that spends substantial time in the center while grooming may be coping with mild stress, while another that remains immobile in the periphery may be experiencing more severe anxiety. Microstructure analysis aids in decoding the complexity behind spatial behavior.
Animals naturally vary in their exploratory style. By analyzing percentage of center time across subjects, researchers can identify behavioral subgroups—such as consistently bold individuals who frequently explore the center versus cautious animals that remain along the periphery. These classifications can be used to examine predictors of drug response, resilience to stress, or vulnerability to neuropsychiatric disorders.
In studies with large cohorts or multiple behavioral variables, machine learning techniques such as hierarchical clustering or principal component analysis can incorporate center time percentage to discover novel phenotypic groupings. These data-driven approaches help uncover latent dimensions of behavior that may not be visible through univariate analyses alone.
Total locomotion helps contextualize center time. Low percentage values in animals with minimal movement may reflect sedation or fatigue, while similar values in high-mobility subjects suggest deliberate avoidance. This metric helps distinguish emotional versus motor causes of low center engagement.
This measure indicates how often the animal initiates exploration of the center zone. When combined with percentage of time, it differentiates between frequent but brief visits (indicative of anxiety or impulsivity) versus fewer but sustained center engagements (suggesting comfort and behavioral confidence).
The delay before the first center entry reflects initial threat appraisal. Longer latencies may be associated with heightened fear or low motivation, while shorter latencies are typically linked to exploratory drive or low anxiety.
Time spent hugging the walls offers a spatial counterbalance to center metrics. High thigmotaxis and low center time jointly support an interpretation of strong avoidance behavior. This inverse relationship helps triangulate affective and motivational states.
By expressing center zone activity as a proportion of total trial time, researchers gain a metric that is resistant to session variability and more readily comparable across time, treatment, and model conditions. This normalized measure enhances reproducibility and statistical power, particularly in multi-cohort or cross-laboratory designs.
For experimental designs aimed at assessing anxiety, exploratory strategy, or affective state, the percentage of time spent in the center offers one of the most robust and interpretable measures available in the Open Field Test.
Written by researchers, for researchers — powered by Conduct Science.


Monday – Friday
9 AM – 5 PM EST
DISCLAIMER: ConductScience and affiliate products are NOT designed for human consumption, testing, or clinical utilization. They are designed for pre-clinical utilization only. Customers purchasing apparatus for the purposes of scientific research or veterinary care affirm adherence to applicable regulatory bodies for the country in which their research or care is conducted.