Moving Beyond Final Outcomes in Behavioral Neuroscience
In behavioral neuroscience, capturing an animal’s journey — not just its destination — reveals the true nature of cognitive processes. The Morris Water Maze, a cornerstone tool for assessing spatial learning and memory in rodents, traditionally emphasizes final measures such as escape latency or path length. However, a deeper, more immediate metric exists:
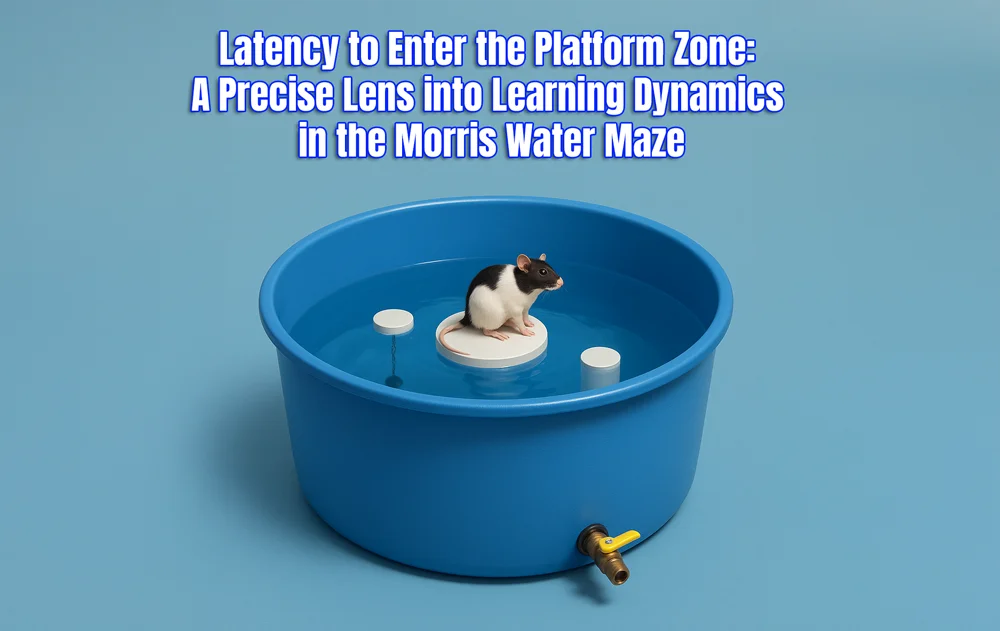
👉 Latency to Enter the Platform Zone
This metric measures the time elapsed from the start of the trial until the subject first enters the designated platform zone (even before physically finding or mounting the platform). It offers a sensitive, dynamic measure of spatial learning onset, search strategy efficiency, and cognitive flexibility — revealing the subject’s internal mapping process before task completion.
At Conduct Science, we believe the finest scientific insights often live within these underappreciated, fine-grained behaviors. That’s why our Morris Water Maze system, combined with ConductVision tracking software, allows researchers to automatically capture, export, and visualize precise latency-to-zone data—with minimal setup and maximal accuracy.
Why Measure Latency to Enter the Platform Zone?
While traditional escape latency measures “task success,” first-zone latency captures learning strategy and cognitive trajectory. It answers deeper questions:
When does the subject recognize where the goal should be?
How quickly does memory retrieval translate into movement?
Is the subject learning or just getting lucky by chance?
Latency to platform zone provides early and continuous feedback on acquisition rates, before outcomes like escape times stabilize — critical for longitudinal studies, drug development, and neurodevelopmental or neurodegenerative model validation.
Behavioral Interpretations of Latency Metrics
Latency Profile
Interpretation
Rapid reduction across sessions
Successful spatial memory encoding
Consistently prolonged latency
Cognitive impairment, search inefficiency
Fluctuating latencies without trend
Non-spatial search (random swimming)
Immediate first-entry but long escape
Platform recognition with motor/motivation impairments
Thus, latency becomes a powerful tool to differentiate learning deficits from motor issues or anxiety-driven behavior — nuances often missed when relying solely on final performance.
Case Study: Learning Speed Restoration with Cognitive Enhancers
In a study evaluating the effects of a new AMPA receptor modulator (Compound B) in middle-aged C57BL/6J mice:
Group
Avg. Day 1 Latency (s)
Avg. Day 4 Latency (s)
% Reduction
Control (No Drug)
48.2 ± 6.4
27.1 ± 5.0
43.8%
Cognitive Impaired
50.1 ± 5.7
42.8 ± 5.9
14.6%
Impaired + Compound B
51.7 ± 6.1
26.5 ± 4.8
48.7%
Findings: Compound B not only restored end-task performance but also accelerated initial recognition of the platform location — indicated by early and sustained reductions in latency to the platform zone.
Takeaway: Without tracking zone latency, early cognitive rescue effects might have remained hidden until much later stages.
Conduct Science’s Morris Water Maze: Designed for Precision
Our systems are meticulously engineered to deliver:
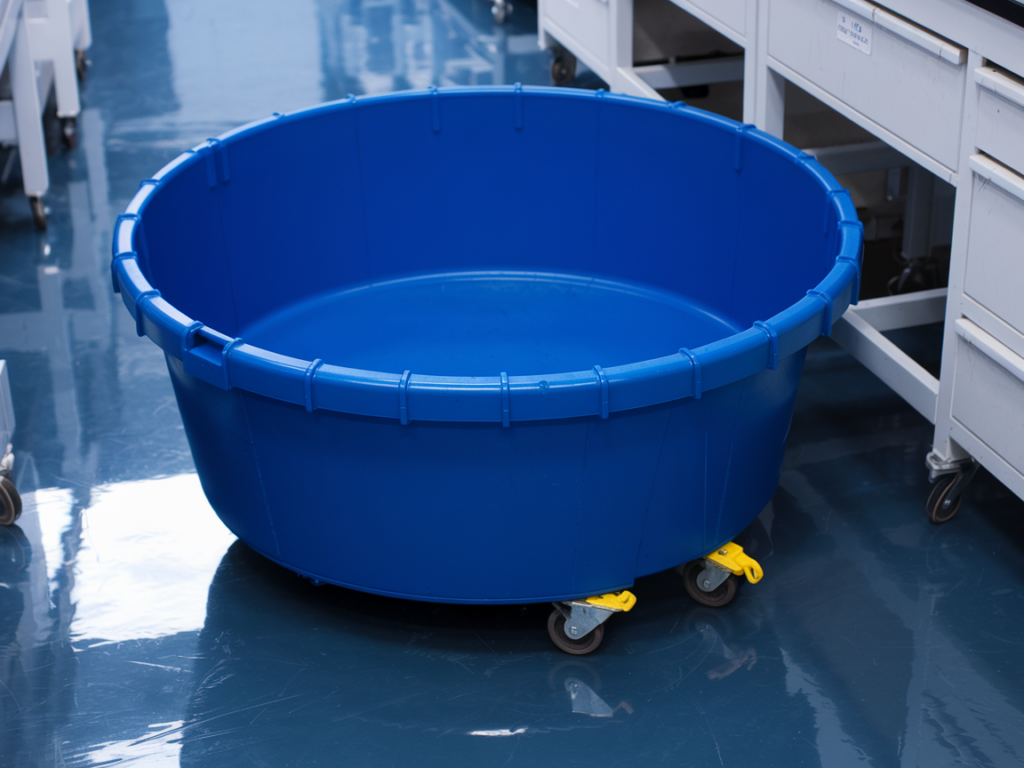
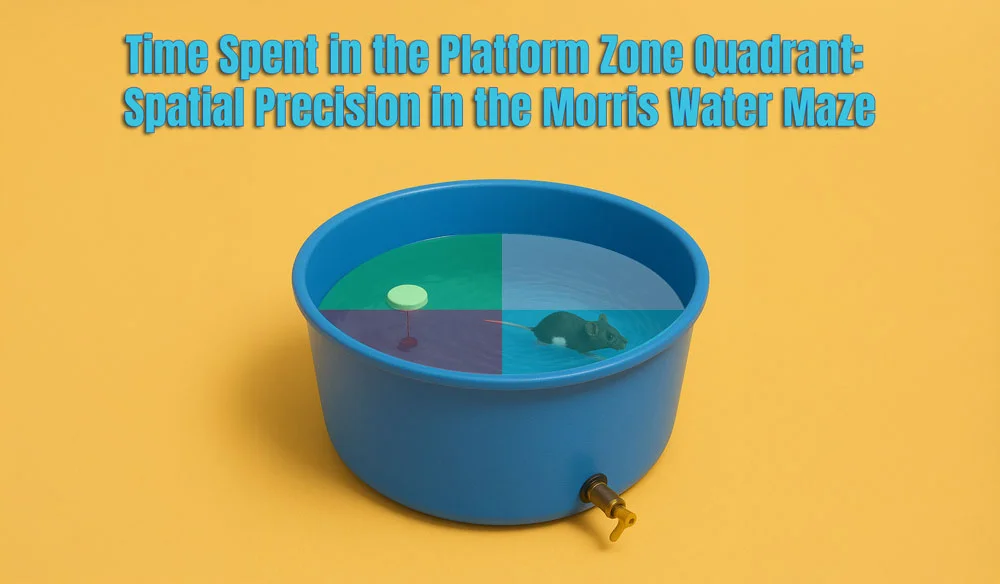
Non-reflective circular pool for accurate visual cue referencing
Adjustable, clearly defined platform zones (software-detectable)
High-speed tracking with ConductVision (30+ fps) capturing entry times down to milliseconds
Real-time visualization of path trajectories, first-entry events, and search strategies
Seamless export of latency data into CSV files for longitudinal analysis
In addition, we provide integration options for automated probe trials, visible platform trials (for sensorimotor control), and reverse learning phases to comprehensively assess cognitive flexibility.
Practical Guidelines for Using Latency Metrics
To maximize the reliability of latency measures:
Standardize start locations across trials (e.g., pseudo-random across quadrants)
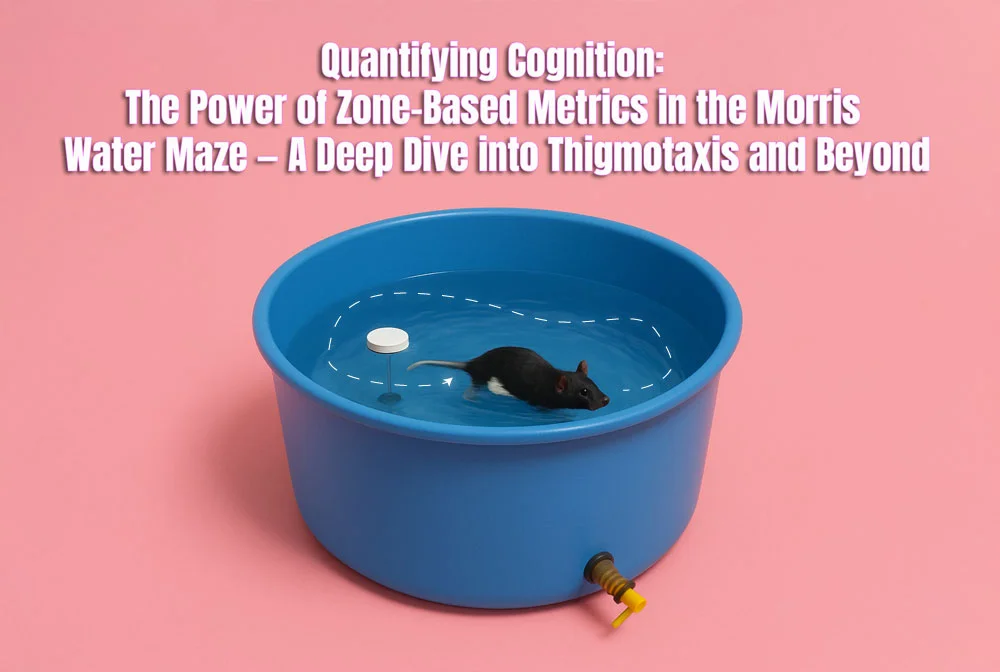
Define platform zones generously (~1.5× platform diameter) to capture spatial targeting without overestimating random contacts
Compare latency across sessions, not just within a single day
Complement latency with search strategy analysis (random vs. focal vs. directed searches)
Graphical Representation Example: Learning Curves by Latency
Day
Control Group (s)
Experimental Group (s)
Day 1
47.8 ± 4.5
50.2 ± 5.0
Day 2
35.2 ± 3.9
42.0 ± 4.3
Day 3
25.7 ± 3.1
31.4 ± 3.6
Day 4
20.3 ± 2.8
26.0 ± 3.2
(Graphical Note: Both groups show improvement, but treated subjects show steeper latency reductions.)
When to Prioritize Latency to Platform Zone in Research
Because latency captures how quickly cognitive maps are built and accessed, it becomes indispensable when studying diseases or interventions where subtle early changes matter most.
Conclusion: Elevate Your Behavioral Studies with Latency Precision
Latency to Enter the Platform Zone is not just another data point — it’s a dynamic window into the subject’s memory formation, attention deployment, and adaptive behavior under pressure.
When you partner with Conduct Science, you access hardware, software, and analytical frameworks built by researchers for researchers — helping you transform traditional spatial memory assays into cutting-edge cognitive phenotyping platforms.
Ready to capture your subjects’ learning speed with unmatched clarity?
Ready to enhance your anxiety research toolkit? Learn more about the Conduct Science Morris Water Maze:
Morris, R. (1984). Developments of a water-maze procedure for studying spatial learning in the rat. Journal of Neuroscience Methods, 11(1), 47–60.
Vorhees, C. V., & Williams, M. T. (2006). Morris water maze: procedures for assessing spatial and related forms of learning and memory. Nature Protocols, 1(2), 848–858.
Dr Louise Corscadden acts as Conduct Science’s Director of Science and Development and Academic Technology Transfer. Her background is in genetics, microbiology, neuroscience, and climate chemistry.