


Magnetic resonance imaging is an advanced, non-invasive diagnostic medical imaging technique that provides three-dimensional images of organs. The discovery of MRI involves a series of successful events that started in 1946 when Felix Bolch proposed the new magnetic properties of the atomic nucleus[1]. He explained the behavior of atoms at tiny magnets, and based on these, NMR tools were developed[2].
Paul Lauterberg, the pioneer of MRI, introduced the concept of “tissue characterization” after the discovery that the affected and normal tissue shows different NMR (nuclear magnetic resonance) parameters by Raymond Damadian[1]. Then, the phenomenon of tissue characterization or tissue/organ imaging using the magnetic field was termed Magnetic resonance imaging.
Techniques other than MRI, like X-ray, produce gray and flat images without contrast compared to MRI which produces images with excellent contrast resolution in any dimension. This property helps in capturing even small lesions in tissues and to identify multiple sclerosis, tumors, tendonitis, strokes, and many other abnormalities[1].
This article poses the workings of magnetic resonance imaging, its principle, application, advantages, and disadvantages[1]. You will also learn what safety measures you should take while using the machine. So, let’s get started.
The atomic nucleus is made of protons that contain positive charge, neutrons having neutral charge, and electrons that carry a negative charge. The similarity between these particles is to spin about their axis and possess an intrinsic spin of ½ which can be positive or negative. The spin is also called the angular momentum of the particles[2].
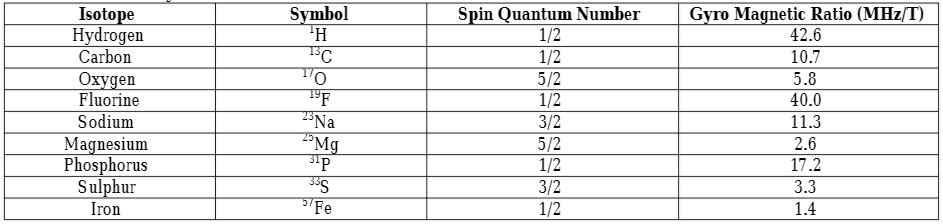
Each nucleus has its spin characteristic depending on the number of protons and neutrons present in it. For example, if a nucleus has an even number of electrons and protons, then, they can be arranged in such a way that their spin gets canceled. However, when the particles are in odd numbers, some of the spins will not be canceled, which creates a net spin-charge and produces magnetic properties known as a magnetic moment[2]. So, when the spin is placed in a magnetic field, it rotates around its axis by absorbing photons at certain frequencies which depends on the gyromagnetic ratio of the particle[2]. The equation explains the relation:
V = 𝝲B, for hydrogen, 𝝲 = 42.58 MHz/T
The magnetic property of the atomic nuclei is utilized in MRI to produce images of organs and the elements having unpaired protons are preferred (see table for MRI friendly elements). However, the hydrogen element is mostly preferred as an MRI imaging source because of the following three[2] reasons:
Elements preferred for MRI[1]
The protons present in the atom are randomly oriented in the absence of an external magnetic field, however, when the magnetic field is applied to the sample, all the protons are arranged according to the applied field. This occurs in two[1] ways:
The north and south poles of protons do not exactly align in the direction of the applied magnetic field and somewhat tilt from the direction parallel to the applied magnetic field. This wobbling/oscillation of protons is called precession and the rate or frequency of precession is called Larmor frequency[1]. The equation expressing Larmor frequency is:
F = r B
Here, F = Larmor or resonant frequency (MHz)
r = gyromagnetic ratio of protons (MHz/T)
B = strength of applied magnetic field (T)
Larmor frequency determines the frequency of the MRI. The Larmor frequency of hydrogen in the 1T applied magnetic field is 42.58 MHz and the MRI requires the magnetic field strength ranging from 0.1T to 4.0T. The net magnetization of elements in the applied magnetic field strength is denoted by MZ[1].
The radio-frequency is sent through the patient’s body to manipulate the net magnetization vector. The radio-frequency when matches the center frequency, creates a resonance, and only protons that spin at the radio frequency, respond to the applied pulse.
The radio-frequency interacts with every component attached to the patient’s body (tissue, any foreign element, or metallic implants). During imaging, it is transformed into heat and the absorption and generation of heat take place in tissues[1]. This thermal characteristic is different for different organ systems. For example, limbs dissipate thermal energy more rapidly than the abdomen whereas the eyes take much more time to dissipate thermal energy[1].
The radio pulse should be provided for sufficient duration to generate an intensity that rotates the net magnetization vector and produce signals which help to transform and create the image. The bound state and presence and absence of hydrogen in tissue are some of the factors that play a role in the generation of the signal. For example, hydrogens in the bone present in a tightly bound state and do not produce any usable signal.
T-1 relaxation is defined as the time tissues take for the longitudinal magnetization to reach 63% of the original magnetization. When the pulse stops, the protons in the higher energy state want to go back to the lower energy state[1]. The bound state of hydrogen also determines the differences in the rate of relaxation of protons in tissues. For example, in fat tissues, hydrogens are in a bound state so the rate of relaxation is low as compared to water. This specific property is involved in creating a contrast image in MRI.
When the radio-frequency is applied at 90o, all magnetization flipped in the XY plane, called transverse magnetization[1]. At the same time, the protons start to rotate “in-phase” i.e all vectors align in one direction. However, this alignment is disturbed by the other surrounding vectors. So, the rate of the flip will be different in different vectors. This will disturb the alignment of vectors in the same direction and start “de-phasing”. This phenomenon of vectors getting from in-phase to out-of-phase or de-phase is called T2 relaxation[1].
It should be noted that the T1 and T2 relaxation processes are independent of each other but occur simultaneously. This whole physics of protons during MRI help to create a contrast image[1].
The magnets in MRIs produce a strong magnetic field that forces the protons in the body to align with the field in the same direction, an equilibrium is maintained. This equilibrium is disturbed when an external radiofrequency pulse is applied through the patient[5]. In this condition, the protons reach a higher energy state and are opposite to the applied magnetic field.
However, when the external radiofrequency pulse is stopped, the protons return to the lower energy state to realign with the magnetic field which is detected by the MRI sensors.
The time protons take to align with the magnetic field and the amount of energy released depends on the environment and chemical nature of the molecule. These differences in protons of different tissues based on the magnetic field help physicians to tell the difference between two tissues[5].
Contrast agents are given to patients intravenously to fasten the process of alignment of protons. The faster the realignment of protons, the brighter the images are produced.
MR imaging has the potential to produce a clear picture of the anatomy and detect anomalies in the body. Here, clinical applications of MR imaging based on the region of the body is explained[1] in brief.
The advantages[1] of MR imaging include:
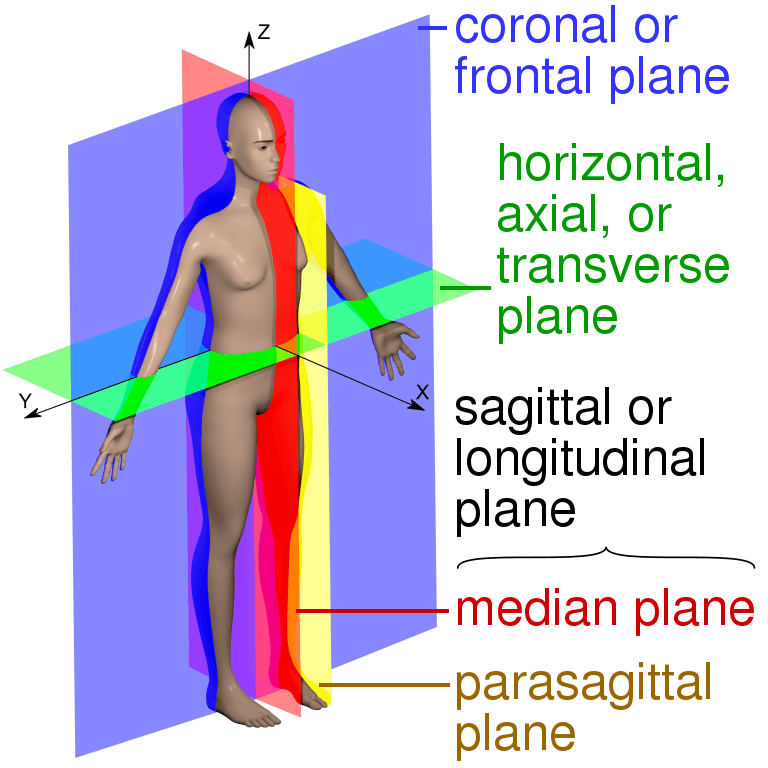
Figure: The image showing different anatomical planes that MRI can capture[7].
Source: https://commons.wikimedia.org/wiki/File:Human_anatomy_planes,_labeled.svg
Despite certain limitations, magnetic resonance imaging is an efficient tool serving several clinical applications. The best thing is the absence of harmful radiation during the whole procedure. It has made it possible to produce a high quality and contrast image of affected parts. In terms of safety and sensitivity, it can replace many other invasive and risky techniques. It helps to detect any pathological changes during the early phase.
However, making the procedure more comfortable for the patients by the reduction in coil noise and tube length may help many other individuals in their diagnostic procedures. Further, advances in the process of imaging and dynamic scanning will enhance and broaden its application in the future.
In behavioral neuroscience, the Open Field Test (OFT) remains one of the most widely used assays to evaluate rodent models of affect, cognition, and motivation. It provides a non-invasive framework for examining how animals respond to novelty, stress, and pharmacological or environmental manipulations. Among the test’s core metrics, the percentage of time spent in the center zone offers a uniquely normalized and sensitive measure of an animal’s emotional reactivity and willingness to engage with a potentially risky environment.
This metric is calculated as the proportion of time spent in the central area of the arena—typically the inner 25%—relative to the entire session duration. By normalizing this value, researchers gain a behaviorally informative variable that is resilient to fluctuations in session length or overall movement levels. This makes it especially valuable in comparative analyses, longitudinal monitoring, and cross-model validation.
Unlike raw center duration, which can be affected by trial design inconsistencies, the percentage-based measure enables clearer comparisons across animals, treatments, and conditions. It plays a key role in identifying trait anxiety, avoidance behavior, risk-taking tendencies, and environmental adaptation, making it indispensable in both basic and translational research contexts.
Whereas simple center duration provides absolute time, the percentage-based metric introduces greater interpretability and reproducibility, especially when comparing different animal models, treatment conditions, or experimental setups. It is particularly effective for quantifying avoidance behaviors, risk assessment strategies, and trait anxiety profiles in both acute and longitudinal designs.
This metric reflects the relative amount of time an animal chooses to spend in the open, exposed portion of the arena—typically defined as the inner 25% of a square or circular enclosure. Because rodents innately prefer the periphery (thigmotaxis), time in the center is inversely associated with anxiety-like behavior. As such, this percentage is considered a sensitive, normalized index of:
Critically, because this metric is normalized by session duration, it accommodates variability in activity levels or testing conditions. This makes it especially suitable for comparing across individuals, treatment groups, or timepoints in longitudinal studies.
A high percentage of center time indicates reduced anxiety, increased novelty-seeking, or pharmacological modulation (e.g., anxiolysis). Conversely, a low percentage suggests emotional inhibition, behavioral avoidance, or contextual hypervigilance. reduced anxiety, increased novelty-seeking, or pharmacological modulation (e.g., anxiolysis). Conversely, a low percentage suggests emotional inhibition, behavioral avoidance, or contextual hypervigilance.
The percentage of center time is one of the most direct, unconditioned readouts of anxiety-like behavior in rodents. It is frequently reduced in models of PTSD, chronic stress, or early-life adversity, where animals exhibit persistent avoidance of the center due to heightened emotional reactivity. This metric can also distinguish between acute anxiety responses and enduring trait anxiety, especially in longitudinal or developmental studies. Its normalized nature makes it ideal for comparing across cohorts with variable locomotor profiles, helping researchers detect true affective changes rather than activity-based confounds.
Rodents that spend more time in the center zone typically exhibit broader and more flexible exploration strategies. This behavior reflects not only reduced anxiety but also cognitive engagement and environmental curiosity. High center percentage is associated with robust spatial learning, attentional scanning, and memory encoding functions, supported by coordinated activation in the prefrontal cortex, hippocampus, and basal forebrain. In contrast, reduced center engagement may signal spatial rigidity, attentional narrowing, or cognitive withdrawal, particularly in models of neurodegeneration or aging.
The open field test remains one of the most widely accepted platforms for testing anxiolytic and psychotropic drugs. The percentage of center time reliably increases following administration of anxiolytic agents such as benzodiazepines, SSRIs, and GABA-A receptor agonists. This metric serves as a sensitive and reproducible endpoint in preclinical dose-finding studies, mechanistic pharmacology, and compound screening pipelines. It also aids in differentiating true anxiolytic effects from sedation or motor suppression by integrating with other behavioral parameters like distance traveled and entry count (Prut & Belzung, 2003).
Sex-based differences in emotional regulation often manifest in open field behavior, with female rodents generally exhibiting higher variability in center zone metrics due to hormonal cycling. For example, estrogen has been shown to facilitate exploratory behavior and increase center occupancy, while progesterone and stress-induced corticosterone often reduce it. Studies involving gonadectomy, hormone replacement, or sex-specific genetic knockouts use this metric to quantify the impact of endocrine factors on anxiety and exploratory behavior. As such, it remains a vital tool for dissecting sex-dependent neurobehavioral dynamics.
The percentage of center time is one of the most direct, unconditioned readouts of anxiety-like behavior in rodents. It is frequently reduced in models of PTSD, chronic stress, or early-life adversity. Because it is normalized, this metric is especially helpful for distinguishing between genuine avoidance and low general activity.
Environmental Control: Uniformity in environmental conditions is essential. Lighting should be evenly diffused to avoid shadow bias, and noise should be minimized to prevent stress-induced variability. The arena must be cleaned between trials using odor-neutral solutions to eliminate scent trails or pheromone cues that may affect zone preference. Any variation in these conditions can introduce systematic bias in center zone behavior. Use consistent definitions of the center zone (commonly 25% of total area) to allow valid comparisons. Software-based segmentation enhances spatial precision.
Evaluating how center time evolves across the duration of a session—divided into early, middle, and late thirds—provides insight into behavioral transitions and adaptive responses. Animals may begin by avoiding the center, only to gradually increase center time as they habituate to the environment. Conversely, persistently low center time across the session can signal prolonged anxiety, fear generalization, or a trait-like avoidance phenotype.
To validate the significance of center time percentage, it should be examined alongside results from other anxiety-related tests such as the Elevated Plus Maze, Light-Dark Box, or Novelty Suppressed Feeding. Concordance across paradigms supports the reliability of center time as a trait marker, while discordance may indicate task-specific reactivity or behavioral dissociation.
When paired with high-resolution scoring of behavioral events such as rearing, grooming, defecation, or immobility, center time offers a richer view of the animal’s internal state. For example, an animal that spends substantial time in the center while grooming may be coping with mild stress, while another that remains immobile in the periphery may be experiencing more severe anxiety. Microstructure analysis aids in decoding the complexity behind spatial behavior.
Animals naturally vary in their exploratory style. By analyzing percentage of center time across subjects, researchers can identify behavioral subgroups—such as consistently bold individuals who frequently explore the center versus cautious animals that remain along the periphery. These classifications can be used to examine predictors of drug response, resilience to stress, or vulnerability to neuropsychiatric disorders.
In studies with large cohorts or multiple behavioral variables, machine learning techniques such as hierarchical clustering or principal component analysis can incorporate center time percentage to discover novel phenotypic groupings. These data-driven approaches help uncover latent dimensions of behavior that may not be visible through univariate analyses alone.
Total locomotion helps contextualize center time. Low percentage values in animals with minimal movement may reflect sedation or fatigue, while similar values in high-mobility subjects suggest deliberate avoidance. This metric helps distinguish emotional versus motor causes of low center engagement.
This measure indicates how often the animal initiates exploration of the center zone. When combined with percentage of time, it differentiates between frequent but brief visits (indicative of anxiety or impulsivity) versus fewer but sustained center engagements (suggesting comfort and behavioral confidence).
The delay before the first center entry reflects initial threat appraisal. Longer latencies may be associated with heightened fear or low motivation, while shorter latencies are typically linked to exploratory drive or low anxiety.
Time spent hugging the walls offers a spatial counterbalance to center metrics. High thigmotaxis and low center time jointly support an interpretation of strong avoidance behavior. This inverse relationship helps triangulate affective and motivational states.
By expressing center zone activity as a proportion of total trial time, researchers gain a metric that is resistant to session variability and more readily comparable across time, treatment, and model conditions. This normalized measure enhances reproducibility and statistical power, particularly in multi-cohort or cross-laboratory designs.
For experimental designs aimed at assessing anxiety, exploratory strategy, or affective state, the percentage of time spent in the center offers one of the most robust and interpretable measures available in the Open Field Test.
Written by researchers, for researchers — powered by Conduct Science.


Monday – Friday
9 AM – 5 PM EST
DISCLAIMER: ConductScience and affiliate products are NOT designed for human consumption, testing, or clinical utilization. They are designed for pre-clinical utilization only. Customers purchasing apparatus for the purposes of scientific research or veterinary care affirm adherence to applicable regulatory bodies for the country in which their research or care is conducted.