Basic Data Visualization
- We take the data provided and optimize it to elaborate data models according to your requirements and goals; conceptual models, logical models, or physical models.
- Using the right tools to create a flow that transforms the data and the models into visualizations.
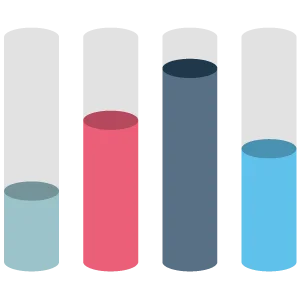
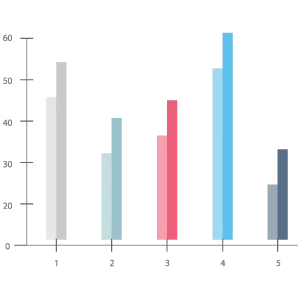
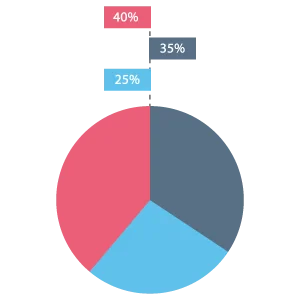
- Representation of the data in form of relevant visuals such as charts, infographics, and graphs.
- Visualizations can be modified anytime following your preferences.
Data Analysis + Visualization
- Trend identification by reading and interpreting the data provided, using the right tools to identify and organize patterns.
- ETL & ELT methods to process and integrate the data provided using the sources that fit the data.
- Latest programs and software to process the data provide and transform into relevant information to share: Xplenty, Azure HDInsight, Skytree, Talend, Splice Machine, Spark, Apache SAMOA, Lumify, Elasticsearch, R-Programming, IBM SPSS Modeler, and more.
- Creation of data models following requirements and goals; conceptual models, logical models, or physical models.
- Representation of the data in form of relevant visuals such as charts, infographics, and graphs.
- Visualizations like charts, diagrams, maps that simplify and make your data accessible and illustrate your research.
Data Analysis + Visualization + Reports
- Data Analysis services to identify and analyze the trends and patterns in the data provided, using the right tools according to the type of data and goals.
- ETL & ELT methods to process and integrate the data provided using the sources that fit the data.
- Latest programs and software to process the data provide and transform into relevant information to share: Xplenty, Azure HDInsight, Skytree, Talend, Splice Machine, Spark, Apache SAMOA, Lumify, Elasticsearch, R-Programming, IBM SPSS Modeler, and more.
- Creation of data models following requirements and goals; conceptual models, logical models, or physical models.
- Custom reports for you and your team.
- Data Reporting Services to create the dashboards needed according to your data and managers (basic dashboards, dashboards for data exports, or for mid-level management)
- Representation of the data in form of relevant visuals such as charts, infographics, and graphs.
- Representation of the data in form of relevant visuals such as charts, infographics, and graphs.


