
Total Time Active during a fear conditioning experiment refers to the cumulative period an animal is considered “active” within the testing environment. This is defined as any movement that surpasses a predefined threshold of significance, excluding minor adjustments or minimal movements like twitching, grooming, or head bobbing.
In fear conditioning, freezing refers to when the animal remains motionless apart from respiratory movements and is a key sign of fear. ConductVision tracks both movement and freezing, giving a clear view of the animal’s activity during the experiment. It’s important to note that Total Time Active is essentially the complement of Freezing Duration, and these two metrics together provide a full picture of the animal’s movement behavior during the experiment.
In a typical fear conditioning experiment, animals are exposed to a neutral stimulus (e.g., a sound tone or light) followed by an aversive event (such as a mild foot shock). Through repeated pairings, animals learn to connect the stimulus with the aversive event, leading to freezing responses. As previously mentioned, Freezing demonstrates a subject’s fear, while Total Time Active measures movement, often indicating exploratory behaviors and lower fear or anxiety levels.
ConductVision uses advanced algorithms and high-precision video tracking to detect and quantify these movements in real-time. The following illustrates how Total Time Active is captured and processed within ConductVision:
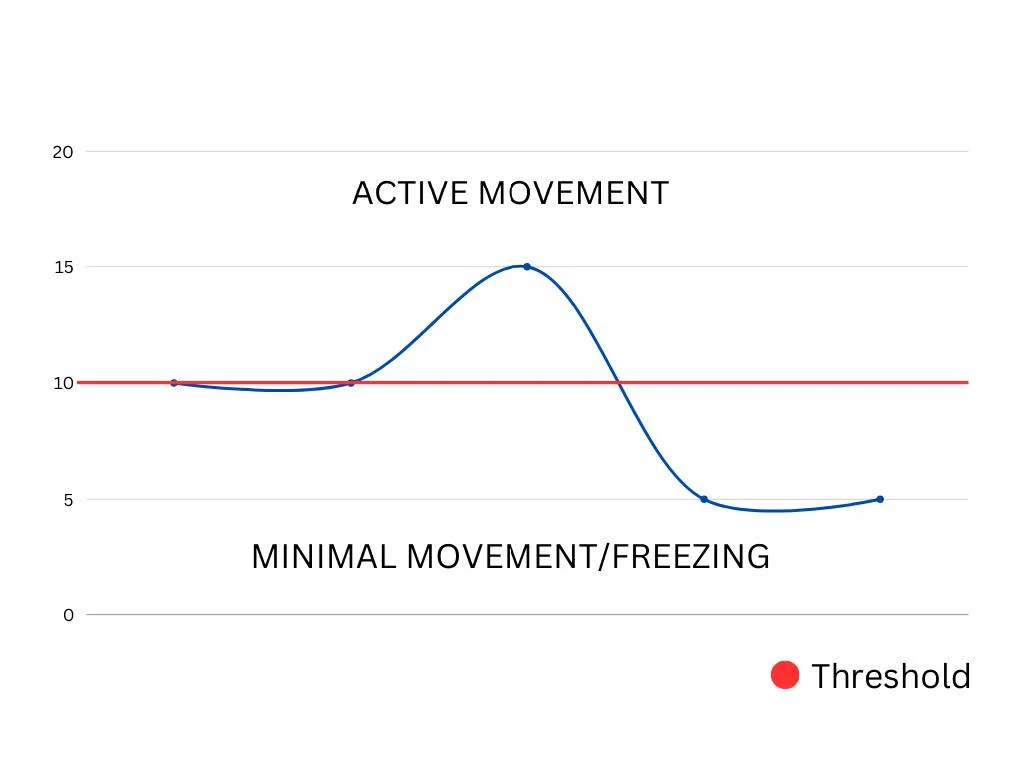
Figure: Researchers can set a threshold to define what qualifies as active movement. Any movement above this threshold (red line) is recorded as active behavior, while anything below is categorized as minimal movement or freezing. Created by Vanja Antonijevic at Conduct Science.






Shuhan He, MD is a dual-board certified physician with expertise in Emergency Medicine and Clinical Informatics. Dr. He works at the Laboratory of Computer Science, clinically in the Department of Emergency Medicine and Instructor of Medicine at Harvard Medical School. He serves as the Program Director of Healthcare Data Analytics at MGHIHP. Dr. He has interests at the intersection of acute care and computer science, utilizing algorithmic approaches to systems with a focus on large actionable data and Bayesian interpretation. Committed to making a positive impact in the field of healthcare through the use of cutting-edge technology and data analytics.
