


Ultracentrifugation is a specialized technique used to spin samples at exceptionally high speeds. Current ultracentrifuges can spin to as much as 150 000 rotations per minute (rpm) (equivalent to 1 000 000 g) (Biocompare, 2019b). However, extreme centrifugal forces may cause overheating, so to avoid sample damage, ultracentrifuges are equipped with vacuum systems that keep a constant temperature in the centrifuge’s rotor (Biocompare, 2019b).
Centrifugation, and ultracentrifugation, is nowadays, at the core of the laboratory routine. Benchtop centrifuges are essential devices in any biology or chemistry laboratory, and they are used on a day-to-day basis in a wide range of experimental protocols, from concentrating solutions to isolating cells and subcellular components. Ultracentrifugation widened the applications of benchtop centrifugation, allowing the isolation of smaller sized particles, and the study of purified molecules and molecular complexes (Ohlendieck & Harding, 2017). In biology, the development of ultracentrifugation in the early 1900s, widened the possibilities of scientific research to the subcellular level, allowing for the differential separation of cellular components, such as organelles, lipid membranes, and even to purify proteins and ribonucleic acids (DNA and RNA).
The basis of ultracentrifugation is the same as normal centrifugation: to separate the components of a solution based on their size and density, and the density (viscosity) of the medium (solvent) (Ohlendieck & Harding, 2017). As a general principle, (ultra)centrifugation abides by the following rules (Ohlendieck & Harding, 2017):
The use of ultracentrifugation over centrifugation (and vice-versa) denotes basic differences between the two techniques. Fundamental differences between centrifugation and ultracentrifugation include:
There is, currently on the market, a wide variety of ultracentrifuges. The choice among different brands and models must consider the type of experimental applications to be performed, the availability of different rotors (making it possible to adapt the ultracentrifuge to different experimental settings), and the temperature range. Some ultracentrifuges further offer remote monitoring and control, and password-protection (Biocompare, 2019b).
It is important to ask: For which experimental setting do I need an ultracentrifuge? In that sense, two types of ultracentrifuges are available: analytical and preparative. Analytical ultracentrifugation is used in the study of purified macromolecules or supramolecular assemblies, while preparative ultracentrifugation is used in the actual separation of tissues, cells, subcellular components, and other biochemically interesting particles (Ohlendieck & Harding, 2017).
Analytical ultracentrifuges are equipped with optical detection systems that allow the researcher to follow the centrifugation process in real-time. These systems may use ultraviolet (UV) light absorption or refracting index interference (RII) optical detection systems (ultracentrifuges may be equipped with one or both types of optical systems) (Cole, 2009). While UV detection directly measures the absorbance (abs) of a substance at a specific wavelength, RII measures changes in the refraction index (radiation direction) of a given substance, compared to the solvent it is dissolved in (Ohlendieck & Harding, 2017). The purpose of analytical centrifugation is different from other types of centrifugation. Although component isolation is possible with analytical centrifugation, the goal of this technique is to obtain data to characterize the sample that is spun (sedimentation velocity, viscosity, concentration, etc.). With analytical centrifugation, it is possible to follow the variations in sample concentration as a function of the applied centrifugal force. This technique is used in two main experimental settings: sedimentation velocity and sedimentation equilibrium studies, which are key in macromolecular characterization (Ohlendieck & Harding, 2017). Results from sedimentation velocity experiments provide data that are used to calculate the molecular size (molecular weight), shape, and molar masses of new chemical molecules, ribonucleic acids, proteins, and others (Cole, 2009; Ohlendieck & Harding, 2017).
Preparative ultracentrifuges are mostly used to process biological samples for further analysis. The most common application of preparative ultracentrifugation is in tissue and subcellular fractionation, to isolate increasingly smaller components of the biological samples (Jasinski, Schwartz, Haque, & Guo, 2015; Martin et al., 2018; Momen-Heravi, 2017; Ohlendieck & Harding, 2017; Wasan, Cassidy, Kennedy, & Peteherych, 2001). For that, two main centrifugation methods are used: differential and density-gradient centrifugation.
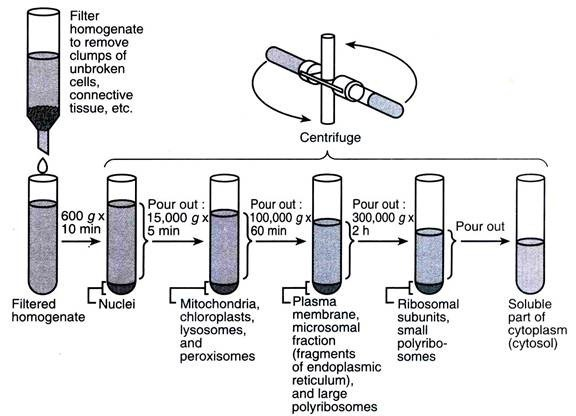
Figure 1: General principle of differential centrifugation, applied to subcellular fractionation (image credit: (Kumar))
Density gradient centrifugation goes further in particle separation than differential centrifugation. It is ideal when the goal is to isolate particles of similar sizes, but different densities. In this case, it is possible to establish density gradient solutions with increasing concentrations of specific materials, in the spinning tubes (Figure 2). Cesium salt gradients are used in the separation of DNA, and sucrose gradients are used in subcellular fractionation to isolate organelles and multiprotein complexes, like ribosomes (Dumetre & Darde, 2004; Perper, Zee, & Mickelson, 1968). Today, there are several commercial gradient solution kits to isolate specific particles. Roughly, there are two types of density gradient centrifugation: rote-zonal centrifugation and isopycnic centrifugation (also called equilibrium centrifugation), which differ in the way particles are separated across the gradient (see Figure 2).
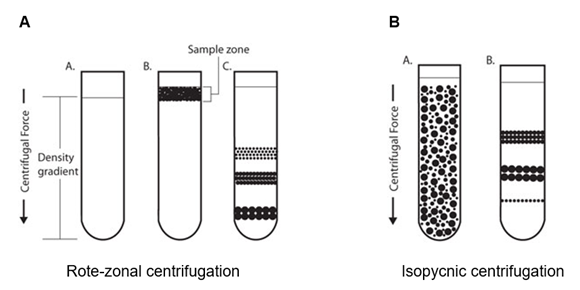
Figure 2: Types of preparative centrifugation. A – Rote-zonal centrifugation B – Isopycnic centrifugation (image credit: (Frei))
Rote-zonal centrifugation – particle separation depends mostly on particle mass. Zones, or bands, are generated, each containing a particle fraction of a specific mass. However, care must be taken when performing rote-zonal centrifugation. Because the mass of the particles is higher than the density of the solvent, if they are centrifuged for too long, all particles will eventually deposit in the bottom of the tube (Frei).
Isopycnic (equilibrium) centrifugation – particle separation depends solely on their density. In isopycnic separation, particles are mixed with the gradient solution, and during centrifugation, they will move until they reach the gradient phase which equals their density (isopycnic or equilibrium point). Because the density of the gradient medium is always higher than the density of particles, these will never sediment, independently of the centrifugation time. Continuous gradients may be used in isopycnic centrifugation, however, discontinuous gradients in which particles form bands at the interface between the density gradient layers are more suitable for the separation of some biological samples, like the separation of lymphocytes from whole blood (Frei; Ohlendieck & Harding, 2017).
Due to their intrinsic differences, analytical and preparative ultracentrifugation are used for different purposes:
Analytical ultracentrifugation
Preparative ultracentrifugation
Modern ultracentrifuges are heavy, sturdy equipment that requires certain know-how for proper usage and care.
From the development of the first ultracentrifuge in the 1920s by Svedberg, up to today, the scientific advances that resulted from the application of ultracentrifugation to biology, chemistry, material science, and others, are countless. In its most obvious approaches, ultracentrifugation extended the limits of biology research to the subcellular level, by allowing the isolation of particles as small as ribosomes, subcellular organelles, membranes, and ribonucleic acids. With the advent of analytical ultracentrifugation, research took another step further towards the understanding of the submicroscopic world, with the ability to further characterize molecular size, shape, and structure. However, ultracentrifugation has its own limitations, like any other laboratory technique. These include:
To date, ultracentrifugation, in its most varied forms and protocols is used routinely and continues to be a fundamental approach not only in academic research but also in industry and the medical context. Nevertheless, it is fundamental to keep in mind how to properly use ultracentrifuges, to keep the sample and device user safe, and to ensure long-term functionality of the devices.
In behavioral neuroscience, the Open Field Test (OFT) remains one of the most widely used assays to evaluate rodent models of affect, cognition, and motivation. It provides a non-invasive framework for examining how animals respond to novelty, stress, and pharmacological or environmental manipulations. Among the test’s core metrics, the percentage of time spent in the center zone offers a uniquely normalized and sensitive measure of an animal’s emotional reactivity and willingness to engage with a potentially risky environment.
This metric is calculated as the proportion of time spent in the central area of the arena—typically the inner 25%—relative to the entire session duration. By normalizing this value, researchers gain a behaviorally informative variable that is resilient to fluctuations in session length or overall movement levels. This makes it especially valuable in comparative analyses, longitudinal monitoring, and cross-model validation.
Unlike raw center duration, which can be affected by trial design inconsistencies, the percentage-based measure enables clearer comparisons across animals, treatments, and conditions. It plays a key role in identifying trait anxiety, avoidance behavior, risk-taking tendencies, and environmental adaptation, making it indispensable in both basic and translational research contexts.
Whereas simple center duration provides absolute time, the percentage-based metric introduces greater interpretability and reproducibility, especially when comparing different animal models, treatment conditions, or experimental setups. It is particularly effective for quantifying avoidance behaviors, risk assessment strategies, and trait anxiety profiles in both acute and longitudinal designs.
This metric reflects the relative amount of time an animal chooses to spend in the open, exposed portion of the arena—typically defined as the inner 25% of a square or circular enclosure. Because rodents innately prefer the periphery (thigmotaxis), time in the center is inversely associated with anxiety-like behavior. As such, this percentage is considered a sensitive, normalized index of:
Critically, because this metric is normalized by session duration, it accommodates variability in activity levels or testing conditions. This makes it especially suitable for comparing across individuals, treatment groups, or timepoints in longitudinal studies.
A high percentage of center time indicates reduced anxiety, increased novelty-seeking, or pharmacological modulation (e.g., anxiolysis). Conversely, a low percentage suggests emotional inhibition, behavioral avoidance, or contextual hypervigilance. reduced anxiety, increased novelty-seeking, or pharmacological modulation (e.g., anxiolysis). Conversely, a low percentage suggests emotional inhibition, behavioral avoidance, or contextual hypervigilance.
The percentage of center time is one of the most direct, unconditioned readouts of anxiety-like behavior in rodents. It is frequently reduced in models of PTSD, chronic stress, or early-life adversity, where animals exhibit persistent avoidance of the center due to heightened emotional reactivity. This metric can also distinguish between acute anxiety responses and enduring trait anxiety, especially in longitudinal or developmental studies. Its normalized nature makes it ideal for comparing across cohorts with variable locomotor profiles, helping researchers detect true affective changes rather than activity-based confounds.
Rodents that spend more time in the center zone typically exhibit broader and more flexible exploration strategies. This behavior reflects not only reduced anxiety but also cognitive engagement and environmental curiosity. High center percentage is associated with robust spatial learning, attentional scanning, and memory encoding functions, supported by coordinated activation in the prefrontal cortex, hippocampus, and basal forebrain. In contrast, reduced center engagement may signal spatial rigidity, attentional narrowing, or cognitive withdrawal, particularly in models of neurodegeneration or aging.
The open field test remains one of the most widely accepted platforms for testing anxiolytic and psychotropic drugs. The percentage of center time reliably increases following administration of anxiolytic agents such as benzodiazepines, SSRIs, and GABA-A receptor agonists. This metric serves as a sensitive and reproducible endpoint in preclinical dose-finding studies, mechanistic pharmacology, and compound screening pipelines. It also aids in differentiating true anxiolytic effects from sedation or motor suppression by integrating with other behavioral parameters like distance traveled and entry count (Prut & Belzung, 2003).
Sex-based differences in emotional regulation often manifest in open field behavior, with female rodents generally exhibiting higher variability in center zone metrics due to hormonal cycling. For example, estrogen has been shown to facilitate exploratory behavior and increase center occupancy, while progesterone and stress-induced corticosterone often reduce it. Studies involving gonadectomy, hormone replacement, or sex-specific genetic knockouts use this metric to quantify the impact of endocrine factors on anxiety and exploratory behavior. As such, it remains a vital tool for dissecting sex-dependent neurobehavioral dynamics.
The percentage of center time is one of the most direct, unconditioned readouts of anxiety-like behavior in rodents. It is frequently reduced in models of PTSD, chronic stress, or early-life adversity. Because it is normalized, this metric is especially helpful for distinguishing between genuine avoidance and low general activity.
Environmental Control: Uniformity in environmental conditions is essential. Lighting should be evenly diffused to avoid shadow bias, and noise should be minimized to prevent stress-induced variability. The arena must be cleaned between trials using odor-neutral solutions to eliminate scent trails or pheromone cues that may affect zone preference. Any variation in these conditions can introduce systematic bias in center zone behavior. Use consistent definitions of the center zone (commonly 25% of total area) to allow valid comparisons. Software-based segmentation enhances spatial precision.
Evaluating how center time evolves across the duration of a session—divided into early, middle, and late thirds—provides insight into behavioral transitions and adaptive responses. Animals may begin by avoiding the center, only to gradually increase center time as they habituate to the environment. Conversely, persistently low center time across the session can signal prolonged anxiety, fear generalization, or a trait-like avoidance phenotype.
To validate the significance of center time percentage, it should be examined alongside results from other anxiety-related tests such as the Elevated Plus Maze, Light-Dark Box, or Novelty Suppressed Feeding. Concordance across paradigms supports the reliability of center time as a trait marker, while discordance may indicate task-specific reactivity or behavioral dissociation.
When paired with high-resolution scoring of behavioral events such as rearing, grooming, defecation, or immobility, center time offers a richer view of the animal’s internal state. For example, an animal that spends substantial time in the center while grooming may be coping with mild stress, while another that remains immobile in the periphery may be experiencing more severe anxiety. Microstructure analysis aids in decoding the complexity behind spatial behavior.
Animals naturally vary in their exploratory style. By analyzing percentage of center time across subjects, researchers can identify behavioral subgroups—such as consistently bold individuals who frequently explore the center versus cautious animals that remain along the periphery. These classifications can be used to examine predictors of drug response, resilience to stress, or vulnerability to neuropsychiatric disorders.
In studies with large cohorts or multiple behavioral variables, machine learning techniques such as hierarchical clustering or principal component analysis can incorporate center time percentage to discover novel phenotypic groupings. These data-driven approaches help uncover latent dimensions of behavior that may not be visible through univariate analyses alone.
Total locomotion helps contextualize center time. Low percentage values in animals with minimal movement may reflect sedation or fatigue, while similar values in high-mobility subjects suggest deliberate avoidance. This metric helps distinguish emotional versus motor causes of low center engagement.
This measure indicates how often the animal initiates exploration of the center zone. When combined with percentage of time, it differentiates between frequent but brief visits (indicative of anxiety or impulsivity) versus fewer but sustained center engagements (suggesting comfort and behavioral confidence).
The delay before the first center entry reflects initial threat appraisal. Longer latencies may be associated with heightened fear or low motivation, while shorter latencies are typically linked to exploratory drive or low anxiety.
Time spent hugging the walls offers a spatial counterbalance to center metrics. High thigmotaxis and low center time jointly support an interpretation of strong avoidance behavior. This inverse relationship helps triangulate affective and motivational states.
By expressing center zone activity as a proportion of total trial time, researchers gain a metric that is resistant to session variability and more readily comparable across time, treatment, and model conditions. This normalized measure enhances reproducibility and statistical power, particularly in multi-cohort or cross-laboratory designs.
For experimental designs aimed at assessing anxiety, exploratory strategy, or affective state, the percentage of time spent in the center offers one of the most robust and interpretable measures available in the Open Field Test.
Written by researchers, for researchers — powered by Conduct Science.


Monday – Friday
9 AM – 5 PM EST
DISCLAIMER: ConductScience and affiliate products are NOT designed for human consumption, testing, or clinical utilization. They are designed for pre-clinical utilization only. Customers purchasing apparatus for the purposes of scientific research or veterinary care affirm adherence to applicable regulatory bodies for the country in which their research or care is conducted.