

Reference to this article: ConductScience, Amino Acids: Building Blocks of Proteins (2022). doi.org/10.55157/CS20220612
Amino acids are organic compounds consisting of carbon, hydrogen, and nitrogen. They are monomers or building blocks of proteins. Proteins are one of the major biomolecules required for the proper functioning of living organisms. Moreover, they are the first biomolecules that were first recognized for their biological roles in organisms than the other biomolecules including carbohydrates, nucleic acids, and lipids.[1]
Moreover, proteins have well-defined physicochemical properties. The linearly arranged amino acid sequence, or one-dimensional protein, guides the formation of the 3-D structure of the protein that determines its interaction with other molecules.[1]
It’s been a century since the observation that when proteins are exposed to hydrolytic actions of boiling acids, they split up into small molecular substances.[2] The amino acid, Glycine, was first discovered and isolated by scientists from gelatin. Soon after this discovery, other amino acids were unmasked including cystine, asparagine, leucine, and threonine — the last of the 20 common amino acids to be found, in 1935.[2]
Several studies led to the discovery of about 500 amino acids by 1983. But, only 20 were found to be present in the genetic code and considered to be the essential building blocks of proteins.[1]
This article brings you an overview of amino acids (monomeric units of proteins), their structures, functions, and applications in the real world.
Out of 20 amino acids, 9 can be synthesized by the human body, and the others are gotten through the food we eat. These criteria categorize these amino acids into two groups: Essential amino acids and non-essential amino acids.
The amino acids not synthesized by the body and required from dietary sources are called essential amino acids. It includes histidine, isoleucine, leucine, lysine, methionine, phenylalanine, threonine, tryptophan, and valine.[4]
They can be obtained from various food sources such as quinoa, egg, meat, chicken, and vegetables.[4] These essential amino acids help the body repair muscle tissues and form precursor molecules for neurotransmitters.
The amino acids synthesized by the body are called non-essential amino acids. They are involved in proper brain function, the production of red blood cells (RBCs) and white blood cells (WBCs), and the removal of toxins from the body. It includes arginine, aspartic acid, glutamic acid, asparagine, glutamine, glutamic acid, proline, glycine, serine, and tyrosine.[5]
Even though they are produced by the body from scratch, the dietary sources containing these amino acids can enhance their availability and functions in the body.[4]
The amino acid structure is composed of an amino group and a carboxyl group along with a side chain R. All amino acids have different side chains, as a result, they show different physicochemical properties and functions.[1] The key elements of the amino acid structures are carbon (C), hydrogen (H), oxygen (O), and nitrogen (N).
All the amino acids, except proline, are known as alpha-amino acids. Proline contains a secondary amine where an alpha carbon is attached to two other carbons. Thus, it is referred to as the alpha-imino group.
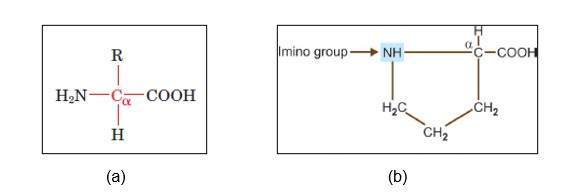
Figure: (a) General structure of alpha-amino acids, and (b) structure of proline showing secondary carbon and imino group.[1]
The amino acids are categorized into three groups based on their side-chain structures:
Nine amino acids have a non-polar side chain in their structures. These include glycine, alanine, valine, leucine, isoleucine, methionine, proline, phenylalanine, and tryptophan.
Glycine has the smallest side chain with an H atom; alanine, valine, and leucine contain an aliphatic hydrophobic side chain; methionine contains a thiol ether side chain; proline has cyclic secondary amino acids; phenylalanine has a phenyl moiety; while tryptophan has a bulky indole aromatic side chain.[3] The aliphatic or aromatic groups attached to these amino acids make them hydrophobic (repel water).
While building proteins, the globular proteins bury these hydrophobic amino acids in the interior of their 3-D shape to prevent them from any water contact.[6]
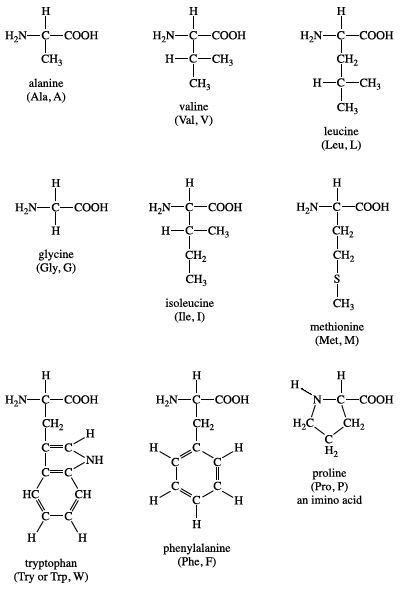
Figure: Structure of non-polar amino acids.[6]
Six amino acids fall in the category of uncharged polar side-chain amino acids. These include serine, threonine, asparagine, glutamine, tyrosine, and cysteine.
The amino acids, serine, and threonine contain aliphatic hydroxyl groups of different sizes; glutamine and asparagine have amide groups of different sizes; tyrosine has phenolic group, an aromatic group like tryptophan and phenylalanine; and cysteine has a unique thiol group attached to it.[3]
These amino acids have available electron pairs that are involved in hydrogen bonding with water and other molecules.[6]
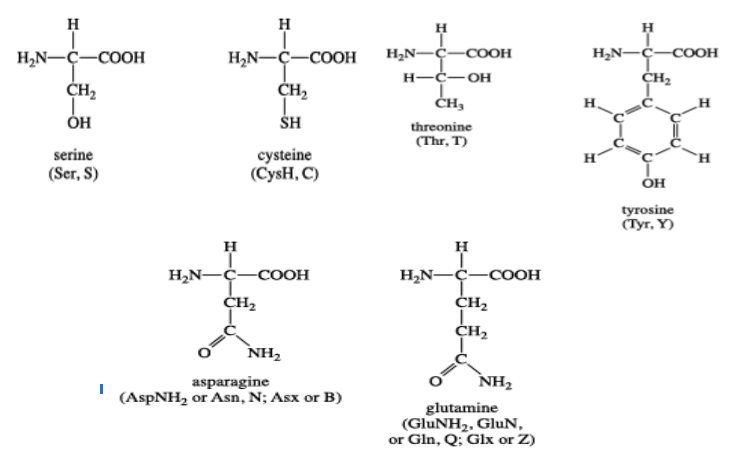
Figure: The structure of polar uncharged amino acids.[4]
The side chain of these amino acids can be positively charged or negatively charged at physiological pH. It includes lysine, glutamic acid, aspartic acid, histidine, and arginine.[3]
Lysine contains a butylammonium side chain; arginine has a guanidino group; histidine bears imidazolium moiety; glutamic acid and aspartic acid carries a carboxylic acid group on their side chain.[3]
In an aqueous solution, at physiological pH, aspartic acid and glutamic acid carry an overall charge of (-1) and are called glutamate and aspartate in their ionic forms. These are also known as acidic amino acids.[6] Whereas, lysine, histidine, arginine possess a (+1) charge at their physiological pH and are called basic amino acids.[4]
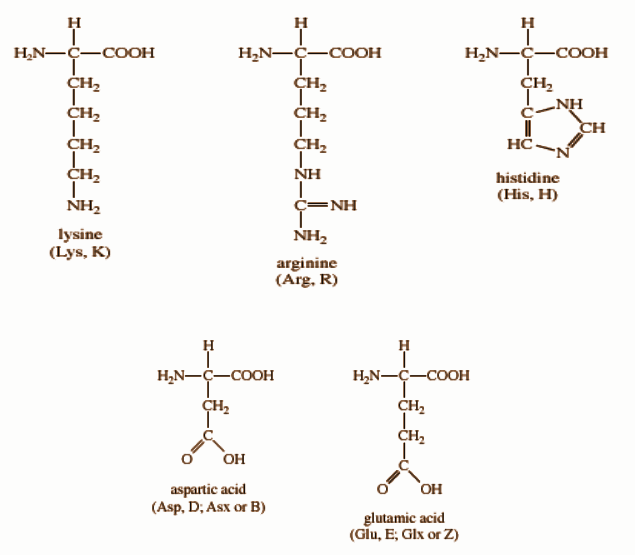
Figure: Structures of polar and charged amino acids.[4]
The amino acids possess different physicochemical properties. These include optical activity, polarity, acidity and basicity, aromaticity, confirmation flexibility, and chemical reactivity. Some of the properties are discussed here in brief.
All the amino acids exist in L-configuration and are superimposable mirror images of each other. This configuration was given by Emil Fischer.[3] L- configuration represents all amino acids that are majorly involved in the translation process for protein synthesis. In some rare cases, D-amino acids are also found in some proteins.
According to the Fischer convention, the configuration of a group around a chiral center can be related to that of glyceraldehyde structure. For alpha-amino acids, the arrangement of the amino, carboxyl, R, and H groups about the C atom is related to that of the hydroxyl, aldehyde, CH2OH, and H groups, respectively, of glyceraldehyde.[3]
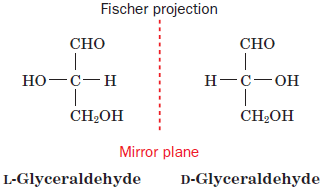
Figure: Fischer convention configuration of glyceraldehyde to which all groups can be related.[3]
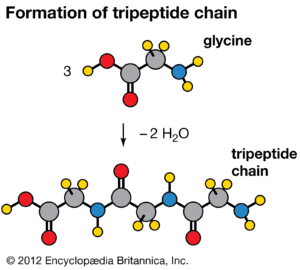
The number and type of amino acids linked together to form proteins ultimately determine the shape, size, and function of the proteins.[7] The amino acids are covalently attached through a peptide bond, which is a result of a condensation reaction.
The carboxyl group of one amino acid combines with the amino group of another amino acid releasing a water molecule, this reaction is called a dehydration or condensation reaction.[7]
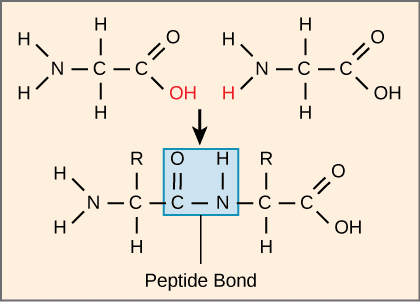
Figure: Peptide bond formation between two amino acids with the release of a water molecule.[7]
Less than 50 amino acids linked together with the peptide bond are called oligopeptides and more than 50 amino acids are combined to form polypeptides. So, the proteins are the result of polypeptide formation, whereas individual amino acids are known as amino acid residues.[6]
It’s also essential to note that an individual amino acid possesses acid-base properties, which are lost in proteins because of the involvement of the carboxyl group in the peptide bond formation. So, the acidity-basicity of proteins depends on the overall ionization characteristics of individual R groups of the amino acid components.
Amino acids, except glycine, isolated after mild hydrolysis of protein can rotate plane-polarized light. This property is known as optical activity. The optically active molecules possess chiral carbons, having four different groups attached to a carbon, called a chiral center.[3]
The asymmetry due to chiral carbons results in non-superimposable mirror images of the molecule, called enantiomers. Glycine has two hydrogens attached to its alpha-carbon and is therefore not optically active.
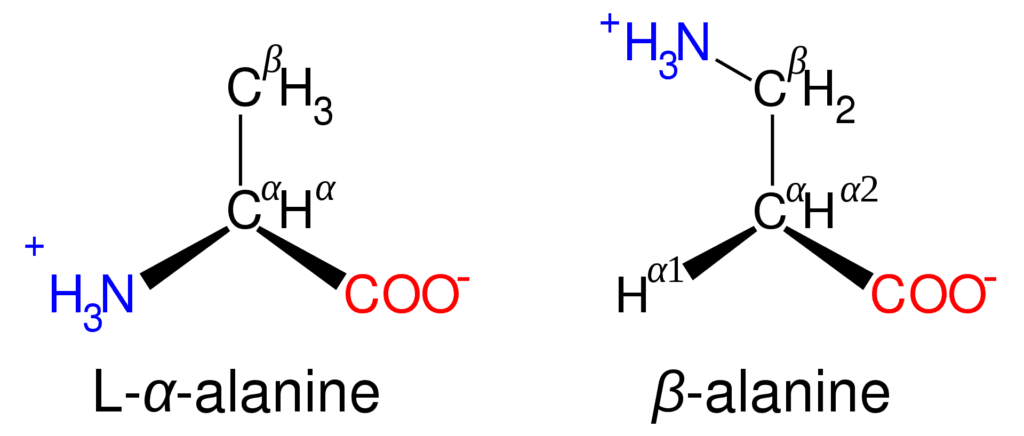
Figure: Structure of alanine isomers.[1]
The concept of enantiomers should not be confused while performing ordinary chemical synthesis. The chemical or physical processes have no stereochemical bias, thus, during the chemical synthesis of chiral molecules, racemic mixtures are produced.[3] Racemic mixtures contain an equal amount of right-hand and left-hand enantiomeric forms of a molecule.
Amino acids are amphoteric molecules, as they can either act as an acid or a base. The acidity and basicity of amino acids are due to charges either on their carboxyl or amino groups.[6]
The pKa value of the basic amino group is between 9 and 10 while that of an acidic carboxyl group is close to 2. The pKa value indicates the strength of amino acids. It is defined as the negative base (-10) log of the acid dissociation constant (Ka) of a solution.
pKa = -log10Ka
The pKa is also defined as the pH value at which the concentration of protonated group is equal to that of the unprotonated group.[6] So, at physiological pH, the amino acids have a balanced charge, equal number of negative and positive charges, on their structure and are called dipolar ion or zwitterion. The pH at which this phenomenon occurs is called the isoelectric point, donated by pI.
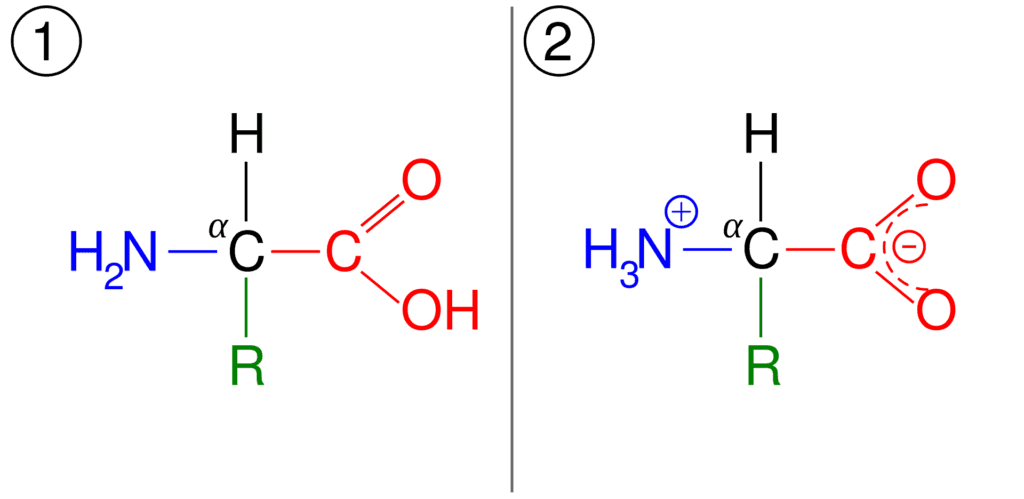
Figure: (1) General structure of amino acid, and (2) its zwitterionic form.[1]
Note: At the isoelectric point, amino acids have a net-zero charge but amino acids are never considered to have an absolute zero charge.[6] Moreover, in an aqueous solution, amino acids never assume a neutral form.
The amino acids undergo several reactions by involving their functional groups. Some chemical reaction processes of amino acids are given below:
All amino acids have some central role to play in the body’s metabolism and functioning. So, given below is a list of essential functions performed by some amino acids:
Amino acids have a variety of application in industries, some of them are listed below:
Amino acids are used to manufacture biodegradable polymers that are used for developing eco-friendly packaging, drug delivery carriers, and prosthetic implants.[1]
Amino acids are building blocks of proteins that are involved in every metabolic function of organisms. The side chain of the amino acids determines their physical and chemical properties. The chemical nature of these amino acids is determined by their functional groups. These functional groups are involved in carrying out several chemical processes in the organisms.
Today, several tools are present to isolate and study amino acids in labs. The advanced technology has facilitated the sequencing of every protein to study from their basic unit, that is, the amino acid. Scientists are meticulously developing several other tools to tackle the challenges faced during the study of these molecules. The area of amino acid and protein research creates an intriguing possibility to discover and uncover several other mysterious properties of these amino acids and their functions in organisms.
In behavioral neuroscience, the Open Field Test (OFT) remains one of the most widely used assays to evaluate rodent models of affect, cognition, and motivation. It provides a non-invasive framework for examining how animals respond to novelty, stress, and pharmacological or environmental manipulations. Among the test’s core metrics, the percentage of time spent in the center zone offers a uniquely normalized and sensitive measure of an animal’s emotional reactivity and willingness to engage with a potentially risky environment.
This metric is calculated as the proportion of time spent in the central area of the arena—typically the inner 25%—relative to the entire session duration. By normalizing this value, researchers gain a behaviorally informative variable that is resilient to fluctuations in session length or overall movement levels. This makes it especially valuable in comparative analyses, longitudinal monitoring, and cross-model validation.
Unlike raw center duration, which can be affected by trial design inconsistencies, the percentage-based measure enables clearer comparisons across animals, treatments, and conditions. It plays a key role in identifying trait anxiety, avoidance behavior, risk-taking tendencies, and environmental adaptation, making it indispensable in both basic and translational research contexts.
Whereas simple center duration provides absolute time, the percentage-based metric introduces greater interpretability and reproducibility, especially when comparing different animal models, treatment conditions, or experimental setups. It is particularly effective for quantifying avoidance behaviors, risk assessment strategies, and trait anxiety profiles in both acute and longitudinal designs.
This metric reflects the relative amount of time an animal chooses to spend in the open, exposed portion of the arena—typically defined as the inner 25% of a square or circular enclosure. Because rodents innately prefer the periphery (thigmotaxis), time in the center is inversely associated with anxiety-like behavior. As such, this percentage is considered a sensitive, normalized index of:
Critically, because this metric is normalized by session duration, it accommodates variability in activity levels or testing conditions. This makes it especially suitable for comparing across individuals, treatment groups, or timepoints in longitudinal studies.
A high percentage of center time indicates reduced anxiety, increased novelty-seeking, or pharmacological modulation (e.g., anxiolysis). Conversely, a low percentage suggests emotional inhibition, behavioral avoidance, or contextual hypervigilance. reduced anxiety, increased novelty-seeking, or pharmacological modulation (e.g., anxiolysis). Conversely, a low percentage suggests emotional inhibition, behavioral avoidance, or contextual hypervigilance.
The percentage of center time is one of the most direct, unconditioned readouts of anxiety-like behavior in rodents. It is frequently reduced in models of PTSD, chronic stress, or early-life adversity, where animals exhibit persistent avoidance of the center due to heightened emotional reactivity. This metric can also distinguish between acute anxiety responses and enduring trait anxiety, especially in longitudinal or developmental studies. Its normalized nature makes it ideal for comparing across cohorts with variable locomotor profiles, helping researchers detect true affective changes rather than activity-based confounds.
Rodents that spend more time in the center zone typically exhibit broader and more flexible exploration strategies. This behavior reflects not only reduced anxiety but also cognitive engagement and environmental curiosity. High center percentage is associated with robust spatial learning, attentional scanning, and memory encoding functions, supported by coordinated activation in the prefrontal cortex, hippocampus, and basal forebrain. In contrast, reduced center engagement may signal spatial rigidity, attentional narrowing, or cognitive withdrawal, particularly in models of neurodegeneration or aging.
The open field test remains one of the most widely accepted platforms for testing anxiolytic and psychotropic drugs. The percentage of center time reliably increases following administration of anxiolytic agents such as benzodiazepines, SSRIs, and GABA-A receptor agonists. This metric serves as a sensitive and reproducible endpoint in preclinical dose-finding studies, mechanistic pharmacology, and compound screening pipelines. It also aids in differentiating true anxiolytic effects from sedation or motor suppression by integrating with other behavioral parameters like distance traveled and entry count (Prut & Belzung, 2003).
Sex-based differences in emotional regulation often manifest in open field behavior, with female rodents generally exhibiting higher variability in center zone metrics due to hormonal cycling. For example, estrogen has been shown to facilitate exploratory behavior and increase center occupancy, while progesterone and stress-induced corticosterone often reduce it. Studies involving gonadectomy, hormone replacement, or sex-specific genetic knockouts use this metric to quantify the impact of endocrine factors on anxiety and exploratory behavior. As such, it remains a vital tool for dissecting sex-dependent neurobehavioral dynamics.
The percentage of center time is one of the most direct, unconditioned readouts of anxiety-like behavior in rodents. It is frequently reduced in models of PTSD, chronic stress, or early-life adversity. Because it is normalized, this metric is especially helpful for distinguishing between genuine avoidance and low general activity.
Environmental Control: Uniformity in environmental conditions is essential. Lighting should be evenly diffused to avoid shadow bias, and noise should be minimized to prevent stress-induced variability. The arena must be cleaned between trials using odor-neutral solutions to eliminate scent trails or pheromone cues that may affect zone preference. Any variation in these conditions can introduce systematic bias in center zone behavior. Use consistent definitions of the center zone (commonly 25% of total area) to allow valid comparisons. Software-based segmentation enhances spatial precision.
Evaluating how center time evolves across the duration of a session—divided into early, middle, and late thirds—provides insight into behavioral transitions and adaptive responses. Animals may begin by avoiding the center, only to gradually increase center time as they habituate to the environment. Conversely, persistently low center time across the session can signal prolonged anxiety, fear generalization, or a trait-like avoidance phenotype.
To validate the significance of center time percentage, it should be examined alongside results from other anxiety-related tests such as the Elevated Plus Maze, Light-Dark Box, or Novelty Suppressed Feeding. Concordance across paradigms supports the reliability of center time as a trait marker, while discordance may indicate task-specific reactivity or behavioral dissociation.
When paired with high-resolution scoring of behavioral events such as rearing, grooming, defecation, or immobility, center time offers a richer view of the animal’s internal state. For example, an animal that spends substantial time in the center while grooming may be coping with mild stress, while another that remains immobile in the periphery may be experiencing more severe anxiety. Microstructure analysis aids in decoding the complexity behind spatial behavior.
Animals naturally vary in their exploratory style. By analyzing percentage of center time across subjects, researchers can identify behavioral subgroups—such as consistently bold individuals who frequently explore the center versus cautious animals that remain along the periphery. These classifications can be used to examine predictors of drug response, resilience to stress, or vulnerability to neuropsychiatric disorders.
In studies with large cohorts or multiple behavioral variables, machine learning techniques such as hierarchical clustering or principal component analysis can incorporate center time percentage to discover novel phenotypic groupings. These data-driven approaches help uncover latent dimensions of behavior that may not be visible through univariate analyses alone.
Total locomotion helps contextualize center time. Low percentage values in animals with minimal movement may reflect sedation or fatigue, while similar values in high-mobility subjects suggest deliberate avoidance. This metric helps distinguish emotional versus motor causes of low center engagement.
This measure indicates how often the animal initiates exploration of the center zone. When combined with percentage of time, it differentiates between frequent but brief visits (indicative of anxiety or impulsivity) versus fewer but sustained center engagements (suggesting comfort and behavioral confidence).
The delay before the first center entry reflects initial threat appraisal. Longer latencies may be associated with heightened fear or low motivation, while shorter latencies are typically linked to exploratory drive or low anxiety.
Time spent hugging the walls offers a spatial counterbalance to center metrics. High thigmotaxis and low center time jointly support an interpretation of strong avoidance behavior. This inverse relationship helps triangulate affective and motivational states.
By expressing center zone activity as a proportion of total trial time, researchers gain a metric that is resistant to session variability and more readily comparable across time, treatment, and model conditions. This normalized measure enhances reproducibility and statistical power, particularly in multi-cohort or cross-laboratory designs.
For experimental designs aimed at assessing anxiety, exploratory strategy, or affective state, the percentage of time spent in the center offers one of the most robust and interpretable measures available in the Open Field Test.
Written by researchers, for researchers — powered by Conduct Science.


Monday – Friday
9 AM – 5 PM EST
DISCLAIMER: ConductScience and affiliate products are NOT designed for human consumption, testing, or clinical utilization. They are designed for pre-clinical utilization only. Customers purchasing apparatus for the purposes of scientific research or veterinary care affirm adherence to applicable regulatory bodies for the country in which their research or care is conducted.