


Microbial growth is defined as an increase in the number of bacterial cells or an increase in the total mass. The cells increase in population through the mode of asexual reproduction, and since no event occurs (such as recombination and crossing between two parents), the produced cells through this mode are identical to each other.
The knowledge of growth in a bacterial population helps researchers control and predict their proliferation in a specific situation. Moreover, understanding the proper nutrient and environmental conditions helps grow them in labs (using culture media) for studies involving these organisms.
Two types of asexual reproduction for bacterial cells’ growth are:
In this article, you will learn about the bacterial growth curve, its phases, and techniques to determine the number of cells in a bacterial population.
Most bacterial species divide and increase their population through binary fission. Cytoplasmic division (known as cytokinesis) and cell division occur via a protein called FtsZ.[2]
FtsZ assembles into a Z-ring anchored by FtsZ binding proteins and defines the plane of division between two daughter cells. A few more proteins bind to the Z-ring, forming a complex structure called a divisome.[2]
The divisome forms a peptidoglycan wall at the point of division and creates a septum responsible for dividing the mother bacterial cells into two daughter cells.
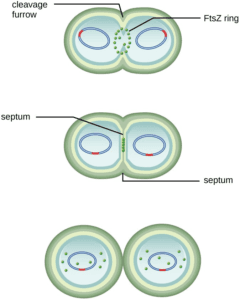
Figure: An illustration of the process of binary fission[2].
Generation time is defined as the average time between two consecutive generations (the birth of the mother and its offspring) in a population’s lineage. For example, the generation time for a human population is an average of 25 years[2].
However, the definition doesn’t suit bacterial populations, which remain dormant for years or reproduce rapidly. In bacteria, the term is called doubling time, and this is because in one round of binary fission, the bacterial population doubles due to division in each cell.
For each bacterial species, the generation time is different. For example, the species of Escherichia, E.coli, has a generation time of 20 minutes under optimal growth conditions[2]. However, other species might take several days to reproduce.
Many other pathogens also grow rapidly, like E. coli; however, there are exceptions. For example, tuberculosis-causing bacteria, Mycobacterium tuberculosis, has a generation time of 15-20 hours, and Hansen’s disease (leprosy) causing bacteria takes up to 14 days to double its population[2].
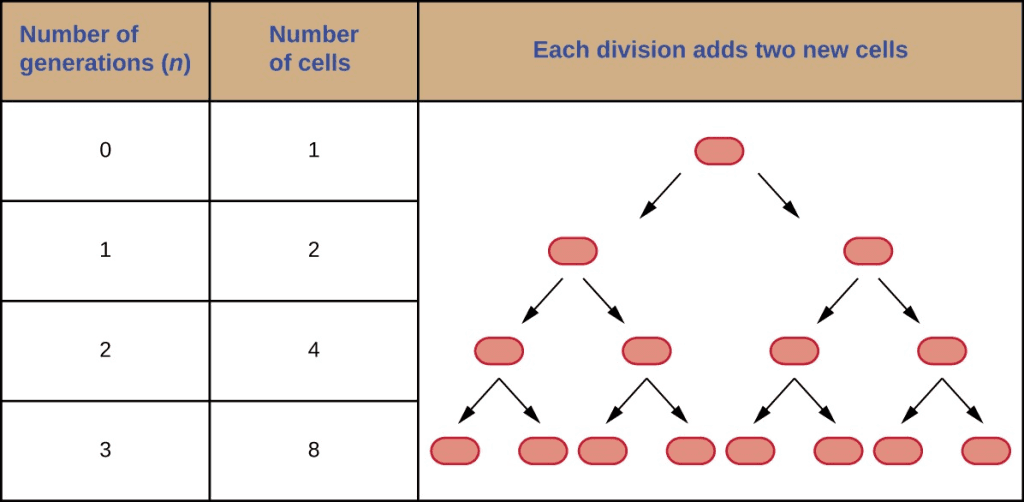
As the bacteria increase exponentially—doubling each generation—the generation time and the number of bacterial cells produced in that period can be calculated using a simple equation.
The exponentially increasing bacteria can be represented by 2n, where n is the generation time of the bacterial species. And for any number of starting cells, the number of population can be calculated by[2]:
Nn = N02n,
Here, Nn is the number of cells at any generation n, N0 is the initial number of bacterial cells before the division starts, and n represents the generation time.
It’s essential to provide an optimum environment and nutrient conditions for microbial growth under lab conditions.
Bacterial species are extensively studied in labs for several purposes. They are grown in either closed systems or batch cultures, in which no additional external nutrients are added, and most waste remains in the container to study their growth patterns.
The culture density of bacterial cells is measured in these systems. The culture density is defined as the number of cells per unit volume, and it provides information on the number of cells or population of bacterial cells in closed systems.
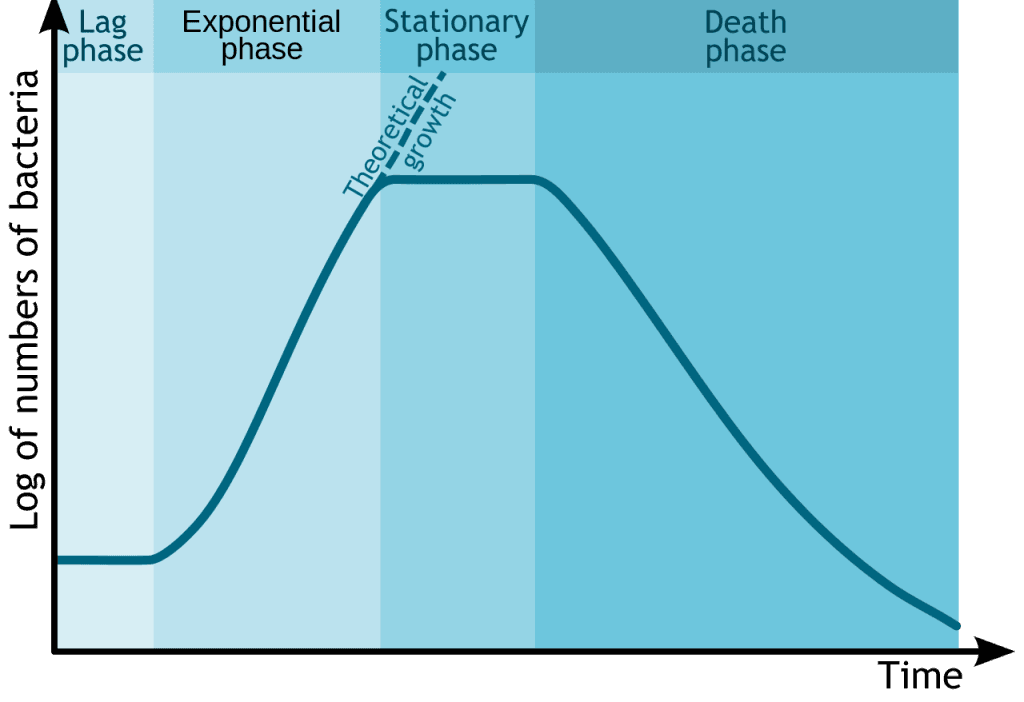
The number of live cells in these cultures is plotted against time, and the growth of bacterial cells is observed in four distinct phases mentioned below.
During the initial phase, a small number of cells are added to the broth, which is called inoculum. The cells are incubated in a suitable environment to support their growth and development.
During the lag phase, the cells gear up for their next phase. They try to settle in the provided environment; however, they do not increase in cell number.
The cells are metabolically active in this phase, grow larger, and synthesize biomolecules, such as proteins, for their growth utilizing the provided medium.
In this phase, cells also repair themselves if any shock or damage occurred during their transfer. The duration of this is determined by factors, including the composition of the medium, the genetic makeup of the cells, cell species, and inoculum size[4].
In the exponential phase, the cells begin to actively divide through binary fission and double their numbers.
You must understand that for any bacterial species, the generation time is determined by their genetic conditions and provided nutrients, pH, temperature, and CO2 concentration in the labs for their growth. Here, this generation time is called intrinsic growth rate[2].
You must also note that bacterial cells at this phase are relatively sensitive to disinfectants and common antibiotics that could affect the formation of DNA, RNA, or proteins required for microbial growth and development.
When the number of bacterial cells grown over time is plotted against time, it gives us an exponential expression; however, when plotted on a semilogarithmic graph, it gives an expression of a linear relationship[4].
The cells in the exponential phases are widely used for research and industrial applications because of their high metabolic activity and constant growth rate.
Due to many reasons, the bacterial cells start settling, and bacterial growth becomes static in this phase.
As cells start growing in the log phase, there’s also an increase in the accumulation of waste products. Since the system is closed, and no extra nutrients are being added from outside, the available nutrients are exhausted. Moreover, the gradual decrease in oxygen level stalls the growth of bacterial cells.
During this phase, bacterial cells switch to survival mode; metabolic activity slows down, so does the development of the peptidoglycan layer, making them less susceptible to antibiotics. Some cells even move to the sporulation stage and start producing endosperm[4].
At this stage, the nutrients are exhausted, and too much waste material has accumulated. Thus, this unfavorable condition leads to the death of cells.
NB: Some industries maintain the logarithmic growth phase of cells by maintaining continuous cultures, in which nutrients are periodically supplied, and the proper aerobic condition is maintained.
Determining bacterial growth in the system is done by many methods, of which the most commonly used ones are[2]:
Bacterial growth is the increase in the number of bacterial cells in a system when proper nutrients and environment are provided. Bacterial species divide through binary fission and exponentially double their population over time. However, after the exhaustion of nutrients and disturbance in the aerobic condition, their growth stagnates and declines.
Thus, the growth of bacterial cells is represented by four phases: lag phase, log phase, stationary phase, and death phase.
The number of cells grown in the system can be determined using bacteria enumeration techniques like the plate count method, direct cell count, or indirect cell counting methods.
The growth curve study and estimation of bacterial numbers are commonly done in microbiological labs or industries. The industry uses the continuous system to grow the bacterial cells to manufacture certain compounds, such as antibiotics, for commercial medical purposes.
In addition, bacterial growth is also required to study the metabolic activities of bacterial species and employ the useful ones to enhance plant growth, create fortified foods, and increase the biodegradation of toxic organic compounds.
In behavioral neuroscience, the Open Field Test (OFT) remains one of the most widely used assays to evaluate rodent models of affect, cognition, and motivation. It provides a non-invasive framework for examining how animals respond to novelty, stress, and pharmacological or environmental manipulations. Among the test’s core metrics, the percentage of time spent in the center zone offers a uniquely normalized and sensitive measure of an animal’s emotional reactivity and willingness to engage with a potentially risky environment.
This metric is calculated as the proportion of time spent in the central area of the arena—typically the inner 25%—relative to the entire session duration. By normalizing this value, researchers gain a behaviorally informative variable that is resilient to fluctuations in session length or overall movement levels. This makes it especially valuable in comparative analyses, longitudinal monitoring, and cross-model validation.
Unlike raw center duration, which can be affected by trial design inconsistencies, the percentage-based measure enables clearer comparisons across animals, treatments, and conditions. It plays a key role in identifying trait anxiety, avoidance behavior, risk-taking tendencies, and environmental adaptation, making it indispensable in both basic and translational research contexts.
Whereas simple center duration provides absolute time, the percentage-based metric introduces greater interpretability and reproducibility, especially when comparing different animal models, treatment conditions, or experimental setups. It is particularly effective for quantifying avoidance behaviors, risk assessment strategies, and trait anxiety profiles in both acute and longitudinal designs.
This metric reflects the relative amount of time an animal chooses to spend in the open, exposed portion of the arena—typically defined as the inner 25% of a square or circular enclosure. Because rodents innately prefer the periphery (thigmotaxis), time in the center is inversely associated with anxiety-like behavior. As such, this percentage is considered a sensitive, normalized index of:
Critically, because this metric is normalized by session duration, it accommodates variability in activity levels or testing conditions. This makes it especially suitable for comparing across individuals, treatment groups, or timepoints in longitudinal studies.
A high percentage of center time indicates reduced anxiety, increased novelty-seeking, or pharmacological modulation (e.g., anxiolysis). Conversely, a low percentage suggests emotional inhibition, behavioral avoidance, or contextual hypervigilance. reduced anxiety, increased novelty-seeking, or pharmacological modulation (e.g., anxiolysis). Conversely, a low percentage suggests emotional inhibition, behavioral avoidance, or contextual hypervigilance.
The percentage of center time is one of the most direct, unconditioned readouts of anxiety-like behavior in rodents. It is frequently reduced in models of PTSD, chronic stress, or early-life adversity, where animals exhibit persistent avoidance of the center due to heightened emotional reactivity. This metric can also distinguish between acute anxiety responses and enduring trait anxiety, especially in longitudinal or developmental studies. Its normalized nature makes it ideal for comparing across cohorts with variable locomotor profiles, helping researchers detect true affective changes rather than activity-based confounds.
Rodents that spend more time in the center zone typically exhibit broader and more flexible exploration strategies. This behavior reflects not only reduced anxiety but also cognitive engagement and environmental curiosity. High center percentage is associated with robust spatial learning, attentional scanning, and memory encoding functions, supported by coordinated activation in the prefrontal cortex, hippocampus, and basal forebrain. In contrast, reduced center engagement may signal spatial rigidity, attentional narrowing, or cognitive withdrawal, particularly in models of neurodegeneration or aging.
The open field test remains one of the most widely accepted platforms for testing anxiolytic and psychotropic drugs. The percentage of center time reliably increases following administration of anxiolytic agents such as benzodiazepines, SSRIs, and GABA-A receptor agonists. This metric serves as a sensitive and reproducible endpoint in preclinical dose-finding studies, mechanistic pharmacology, and compound screening pipelines. It also aids in differentiating true anxiolytic effects from sedation or motor suppression by integrating with other behavioral parameters like distance traveled and entry count (Prut & Belzung, 2003).
Sex-based differences in emotional regulation often manifest in open field behavior, with female rodents generally exhibiting higher variability in center zone metrics due to hormonal cycling. For example, estrogen has been shown to facilitate exploratory behavior and increase center occupancy, while progesterone and stress-induced corticosterone often reduce it. Studies involving gonadectomy, hormone replacement, or sex-specific genetic knockouts use this metric to quantify the impact of endocrine factors on anxiety and exploratory behavior. As such, it remains a vital tool for dissecting sex-dependent neurobehavioral dynamics.
The percentage of center time is one of the most direct, unconditioned readouts of anxiety-like behavior in rodents. It is frequently reduced in models of PTSD, chronic stress, or early-life adversity. Because it is normalized, this metric is especially helpful for distinguishing between genuine avoidance and low general activity.
Environmental Control: Uniformity in environmental conditions is essential. Lighting should be evenly diffused to avoid shadow bias, and noise should be minimized to prevent stress-induced variability. The arena must be cleaned between trials using odor-neutral solutions to eliminate scent trails or pheromone cues that may affect zone preference. Any variation in these conditions can introduce systematic bias in center zone behavior. Use consistent definitions of the center zone (commonly 25% of total area) to allow valid comparisons. Software-based segmentation enhances spatial precision.
Evaluating how center time evolves across the duration of a session—divided into early, middle, and late thirds—provides insight into behavioral transitions and adaptive responses. Animals may begin by avoiding the center, only to gradually increase center time as they habituate to the environment. Conversely, persistently low center time across the session can signal prolonged anxiety, fear generalization, or a trait-like avoidance phenotype.
To validate the significance of center time percentage, it should be examined alongside results from other anxiety-related tests such as the Elevated Plus Maze, Light-Dark Box, or Novelty Suppressed Feeding. Concordance across paradigms supports the reliability of center time as a trait marker, while discordance may indicate task-specific reactivity or behavioral dissociation.
When paired with high-resolution scoring of behavioral events such as rearing, grooming, defecation, or immobility, center time offers a richer view of the animal’s internal state. For example, an animal that spends substantial time in the center while grooming may be coping with mild stress, while another that remains immobile in the periphery may be experiencing more severe anxiety. Microstructure analysis aids in decoding the complexity behind spatial behavior.
Animals naturally vary in their exploratory style. By analyzing percentage of center time across subjects, researchers can identify behavioral subgroups—such as consistently bold individuals who frequently explore the center versus cautious animals that remain along the periphery. These classifications can be used to examine predictors of drug response, resilience to stress, or vulnerability to neuropsychiatric disorders.
In studies with large cohorts or multiple behavioral variables, machine learning techniques such as hierarchical clustering or principal component analysis can incorporate center time percentage to discover novel phenotypic groupings. These data-driven approaches help uncover latent dimensions of behavior that may not be visible through univariate analyses alone.
Total locomotion helps contextualize center time. Low percentage values in animals with minimal movement may reflect sedation or fatigue, while similar values in high-mobility subjects suggest deliberate avoidance. This metric helps distinguish emotional versus motor causes of low center engagement.
This measure indicates how often the animal initiates exploration of the center zone. When combined with percentage of time, it differentiates between frequent but brief visits (indicative of anxiety or impulsivity) versus fewer but sustained center engagements (suggesting comfort and behavioral confidence).
The delay before the first center entry reflects initial threat appraisal. Longer latencies may be associated with heightened fear or low motivation, while shorter latencies are typically linked to exploratory drive or low anxiety.
Time spent hugging the walls offers a spatial counterbalance to center metrics. High thigmotaxis and low center time jointly support an interpretation of strong avoidance behavior. This inverse relationship helps triangulate affective and motivational states.
By expressing center zone activity as a proportion of total trial time, researchers gain a metric that is resistant to session variability and more readily comparable across time, treatment, and model conditions. This normalized measure enhances reproducibility and statistical power, particularly in multi-cohort or cross-laboratory designs.
For experimental designs aimed at assessing anxiety, exploratory strategy, or affective state, the percentage of time spent in the center offers one of the most robust and interpretable measures available in the Open Field Test.
Written by researchers, for researchers — powered by Conduct Science.


Monday – Friday
9 AM – 5 PM EST
DISCLAIMER: ConductScience and affiliate products are NOT designed for human consumption, testing, or clinical utilization. They are designed for pre-clinical utilization only. Customers purchasing apparatus for the purposes of scientific research or veterinary care affirm adherence to applicable regulatory bodies for the country in which their research or care is conducted.