


Electrophysiology refers to studying the electrical properties of biological cells and tissues. Thus, brain or neuronal electrophysiology pertains to a branch of electrophysiology that deals with measuring electric current or voltage changes in one neuronal cell, a brain slice, or the whole brain.
The methodology was first introduced by Yamamoto and Mellwain.[1] Now, it’s a major technical strategy to learn, understand, and get more insight into the physiology and pharmacology of the central nervous system (CNS).[1]
The central role of neurons can be categorized into the motor, sensory, and neurosecretory functions.[2] However, the electrophysiology of these structures is the one responsible for the generation of the action potentials. And these action potentials generated by different neurons show the extrinsic inputs from neurotransmitters and modulators and the integration of intrinsic properties of the membrane.[2]
Brain slice provides insights into the effect of such factors on the electrophysiological behaviors of the neurons of a specific part of the brain. The brain’s hippocampus is usually studied using the brain slice or sectioned brain region. However, it also has the potential to highlight the properties and function of each neuron of the CNS.
Furthermore, the electrophysiological studies of the brain slice play a major role in studying anesthetics and other drugs and understanding their neurophysiological responses.
This article discusses the techniques and applications of brain slice electrophysiology, and also briefly highlights how brain slice is prepared.
Related Read: Cardiac Electrophysiology: How to Setup a Cardiac Electrophysiology Lab
Different types of brain slices are prepared based on the goal of electrophysiology studies.[2] To create uniform slices without the need for freezing or embedding, tissue choppers are preferably used in labs for brain slice preparations. There are mainly three brain slice preparations followed in labs in the context of the question of interest.
They are ~150-350 μm thick, allowing the visualization of neurons under a compound microscope at high magnification for patch-clamp recordings.[2] However, the neurons at the surface aren’t of the best quality and do not provide accurate data or input in the functioning of the neurons. The technique is usually best to study neurons’ intrinsic membrane properties in whole-cell or isolated membrane patches.[2]
Recent microscopic advancements, such as the development of infrared microscopy have allowed the examination of the deeper cells and neurons of the brain slice, thus broadening the applications of thin slice preparations.[2]
They are generally ~500 μm thick and frequently used in brain slice preparations.[2] Because they maintain the local connections between neurons, they are used to examine intrinsic membrane properties, study local synaptic circuits, and drug effects in relatively intact cells.[2]
Additionally, it also has applications in the analysis of network activity, determination of the input pathways through electrical stimulations, and study of the pharmacological manipulations of the brain.[2]
The individual neurons manifest the membrane characteristics of cells in the brain slice. Thus, they are best used to study intrinsic cellular properties.[2]
Isolated neurons have major applications in workflows like single-channel recordings from isolated patches, calcium imaging, whole-cell patch clamp, and intracellular recordings.[2]
Earlier, brain electrophysiology was studied by attaching electrodes to the scalp and measuring brain potential in large areas of the brain. However, in the 20th century, with the discovery of microelectrodes, many electrophysiological recording techniques were developed by scientists, such as the patch-clamp technique, extracellular and intracellular recording, and optical imaging techniques.[3]
In this method, electrodes are inserted into the extracellular fluid, near the cell of interest, to measure the electrical activity being received from neighboring cells or neurons.[4] Here, impedance is determined by the capacitive properties of the electrode-cerebrospinal fluid interface, which are related to electrode material and tip size.
Generally, microelectrodes made of tungsten, gold, insulated steel, or platinum microwires are used to measure the impedance of many neurons simultaneously.[5]
The extracellular recording is further divided into four main groups:[6]
It’s used to determine the general activity of a single neuron in a specific brain region.[2] The limitation of the technique is that it only allows the study of neurons that generate an action potential. Thus, the cells in the silent state or not firing action potential can not be studied using the technique.[2]
The recording is used to study a population of neurons.[2] It allows for the simultaneous assessment of the activities of a group of neurons together (also called unit or synchronous activity). This type of recording is especially useful to describe the excitatory and inhibitory influences on a population of neurons.[2]
It’s done to measure and record the activities of peripheral nerves, such as the bundle of axons.[6] It’s either performed by using telemetry products to record sympathetic nerve activity or by placing a silver wire electrode near the nerve of interest.[6]
Field potentials are recorded from deep within the brain’s cortical tissue. It measures the field potential generated by many cells rather than an individual neuron.[6] It’s of different types, which include electroencephalography (EEG) and electromyographic (EMG).[6] The procedure involved in field potential recording on the skin is either invasive or non-invasive.
In this method, a glass microelectrode is placed against the cell membrane, which leads to the formation of a bond (or high resistance seal) between them known as gigaseal.[7] The contact between the glass pipette and membrane is confirmed by a sudden increase in the resistance.
To prevent the contamination of debris at the pipette tip, when moving inside the cell, a positive pressure is applied. Furthermore, to establish the bond/seal between the pipette and the membrane, voltage pulses or current is applied across the electrode.[7]
The technique can monitor currents passing through ion channels in the membrane within the gigaseal area, which has major applications in studying the basic neuronal membrane properties and synaptic transmission.[7]
When there’s a requirement for the transition of gigaseal to whole seal recording, the seal patch of the membrane is ruptured by applying more suction to the glass pipette.[7]
It monitors the changes in voltage-dependent currents. The basic clamp sets the membrane at the desired voltage.[8] Then, the desired current is added, which allows the measurement of membrane potential across the cell membrane.
Voltage clamp recording is of two types: two-electrode voltage clamp and single electrode voltage clamp. It is suitable to study the current-voltage relationships of membrane channels.[8]
The limitation of performing the technique using the sharp electrode is electrode resistance. Additionally, it is not feasible to clamp the entire cell, which makes it difficult to measure their membrane potential using this technique.[8]
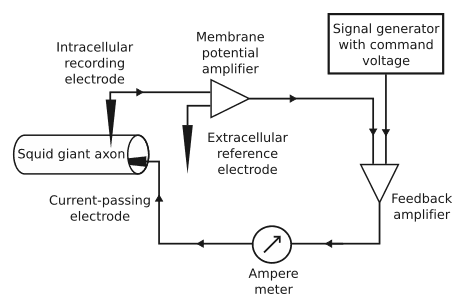
Figure: A schematic diagram of the negative feedback of the voltage clamp.[8]
The intracellular recording is the most traditional approach for recording changes in an individual neuron.[7] Additionally, it can be used to measure the action potentials, postsynaptic potentials, and after potentials of the neurons of interest.
The technique involves the use of a glass pipette with a diameter of less than 20-micrometer. An electrical connection is made between an electronic amplifier and a display through the use of sharp intracellular electrodes that are filled with a conductive saline solution. And through the saline solution in the pipette, an electronic amplifier is connected to the inside of the cell.[7]
This allows researchers to measure the electrical activity within the cell and obtain maximum information related to neuronal or brain activities.[7] However, as the cell is damaged during the penetration of the pipette, it can’t be permanently implanted for neural prostheses.[7]
Brain slice or neuronal electrophysiology is a technique used in neuropathology and similar labs to study and assess the electrical activity of an individual or a population of neurons. The measured membrane potential provides insight into the physiological condition of the brain, its responses to certain stimuli, and the activities of different brain regions.
Brain slice electrophysiology also has a major application in studying the responses of intact brain cells toward drugs. However, the effectiveness of the study depends on the brain slice preparations and electrophysiological approach used to study the actions or membrane potentials of the brain slices.
A range of electrophysiology techniques used in labs for such studies includes patch-clamp technique, voltage recordings, extracellular and intracellular recordings, and current-clamp recording.
If you need a slice workstation to help evaluate tissue slices, then check out our Semi-Automated Slice Workstation.
In behavioral neuroscience, the Open Field Test (OFT) remains one of the most widely used assays to evaluate rodent models of affect, cognition, and motivation. It provides a non-invasive framework for examining how animals respond to novelty, stress, and pharmacological or environmental manipulations. Among the test’s core metrics, the percentage of time spent in the center zone offers a uniquely normalized and sensitive measure of an animal’s emotional reactivity and willingness to engage with a potentially risky environment.
This metric is calculated as the proportion of time spent in the central area of the arena—typically the inner 25%—relative to the entire session duration. By normalizing this value, researchers gain a behaviorally informative variable that is resilient to fluctuations in session length or overall movement levels. This makes it especially valuable in comparative analyses, longitudinal monitoring, and cross-model validation.
Unlike raw center duration, which can be affected by trial design inconsistencies, the percentage-based measure enables clearer comparisons across animals, treatments, and conditions. It plays a key role in identifying trait anxiety, avoidance behavior, risk-taking tendencies, and environmental adaptation, making it indispensable in both basic and translational research contexts.
Whereas simple center duration provides absolute time, the percentage-based metric introduces greater interpretability and reproducibility, especially when comparing different animal models, treatment conditions, or experimental setups. It is particularly effective for quantifying avoidance behaviors, risk assessment strategies, and trait anxiety profiles in both acute and longitudinal designs.
This metric reflects the relative amount of time an animal chooses to spend in the open, exposed portion of the arena—typically defined as the inner 25% of a square or circular enclosure. Because rodents innately prefer the periphery (thigmotaxis), time in the center is inversely associated with anxiety-like behavior. As such, this percentage is considered a sensitive, normalized index of:
Critically, because this metric is normalized by session duration, it accommodates variability in activity levels or testing conditions. This makes it especially suitable for comparing across individuals, treatment groups, or timepoints in longitudinal studies.
A high percentage of center time indicates reduced anxiety, increased novelty-seeking, or pharmacological modulation (e.g., anxiolysis). Conversely, a low percentage suggests emotional inhibition, behavioral avoidance, or contextual hypervigilance. reduced anxiety, increased novelty-seeking, or pharmacological modulation (e.g., anxiolysis). Conversely, a low percentage suggests emotional inhibition, behavioral avoidance, or contextual hypervigilance.
The percentage of center time is one of the most direct, unconditioned readouts of anxiety-like behavior in rodents. It is frequently reduced in models of PTSD, chronic stress, or early-life adversity, where animals exhibit persistent avoidance of the center due to heightened emotional reactivity. This metric can also distinguish between acute anxiety responses and enduring trait anxiety, especially in longitudinal or developmental studies. Its normalized nature makes it ideal for comparing across cohorts with variable locomotor profiles, helping researchers detect true affective changes rather than activity-based confounds.
Rodents that spend more time in the center zone typically exhibit broader and more flexible exploration strategies. This behavior reflects not only reduced anxiety but also cognitive engagement and environmental curiosity. High center percentage is associated with robust spatial learning, attentional scanning, and memory encoding functions, supported by coordinated activation in the prefrontal cortex, hippocampus, and basal forebrain. In contrast, reduced center engagement may signal spatial rigidity, attentional narrowing, or cognitive withdrawal, particularly in models of neurodegeneration or aging.
The open field test remains one of the most widely accepted platforms for testing anxiolytic and psychotropic drugs. The percentage of center time reliably increases following administration of anxiolytic agents such as benzodiazepines, SSRIs, and GABA-A receptor agonists. This metric serves as a sensitive and reproducible endpoint in preclinical dose-finding studies, mechanistic pharmacology, and compound screening pipelines. It also aids in differentiating true anxiolytic effects from sedation or motor suppression by integrating with other behavioral parameters like distance traveled and entry count (Prut & Belzung, 2003).
Sex-based differences in emotional regulation often manifest in open field behavior, with female rodents generally exhibiting higher variability in center zone metrics due to hormonal cycling. For example, estrogen has been shown to facilitate exploratory behavior and increase center occupancy, while progesterone and stress-induced corticosterone often reduce it. Studies involving gonadectomy, hormone replacement, or sex-specific genetic knockouts use this metric to quantify the impact of endocrine factors on anxiety and exploratory behavior. As such, it remains a vital tool for dissecting sex-dependent neurobehavioral dynamics.
The percentage of center time is one of the most direct, unconditioned readouts of anxiety-like behavior in rodents. It is frequently reduced in models of PTSD, chronic stress, or early-life adversity. Because it is normalized, this metric is especially helpful for distinguishing between genuine avoidance and low general activity.
Environmental Control: Uniformity in environmental conditions is essential. Lighting should be evenly diffused to avoid shadow bias, and noise should be minimized to prevent stress-induced variability. The arena must be cleaned between trials using odor-neutral solutions to eliminate scent trails or pheromone cues that may affect zone preference. Any variation in these conditions can introduce systematic bias in center zone behavior. Use consistent definitions of the center zone (commonly 25% of total area) to allow valid comparisons. Software-based segmentation enhances spatial precision.
Evaluating how center time evolves across the duration of a session—divided into early, middle, and late thirds—provides insight into behavioral transitions and adaptive responses. Animals may begin by avoiding the center, only to gradually increase center time as they habituate to the environment. Conversely, persistently low center time across the session can signal prolonged anxiety, fear generalization, or a trait-like avoidance phenotype.
To validate the significance of center time percentage, it should be examined alongside results from other anxiety-related tests such as the Elevated Plus Maze, Light-Dark Box, or Novelty Suppressed Feeding. Concordance across paradigms supports the reliability of center time as a trait marker, while discordance may indicate task-specific reactivity or behavioral dissociation.
When paired with high-resolution scoring of behavioral events such as rearing, grooming, defecation, or immobility, center time offers a richer view of the animal’s internal state. For example, an animal that spends substantial time in the center while grooming may be coping with mild stress, while another that remains immobile in the periphery may be experiencing more severe anxiety. Microstructure analysis aids in decoding the complexity behind spatial behavior.
Animals naturally vary in their exploratory style. By analyzing percentage of center time across subjects, researchers can identify behavioral subgroups—such as consistently bold individuals who frequently explore the center versus cautious animals that remain along the periphery. These classifications can be used to examine predictors of drug response, resilience to stress, or vulnerability to neuropsychiatric disorders.
In studies with large cohorts or multiple behavioral variables, machine learning techniques such as hierarchical clustering or principal component analysis can incorporate center time percentage to discover novel phenotypic groupings. These data-driven approaches help uncover latent dimensions of behavior that may not be visible through univariate analyses alone.
Total locomotion helps contextualize center time. Low percentage values in animals with minimal movement may reflect sedation or fatigue, while similar values in high-mobility subjects suggest deliberate avoidance. This metric helps distinguish emotional versus motor causes of low center engagement.
This measure indicates how often the animal initiates exploration of the center zone. When combined with percentage of time, it differentiates between frequent but brief visits (indicative of anxiety or impulsivity) versus fewer but sustained center engagements (suggesting comfort and behavioral confidence).
The delay before the first center entry reflects initial threat appraisal. Longer latencies may be associated with heightened fear or low motivation, while shorter latencies are typically linked to exploratory drive or low anxiety.
Time spent hugging the walls offers a spatial counterbalance to center metrics. High thigmotaxis and low center time jointly support an interpretation of strong avoidance behavior. This inverse relationship helps triangulate affective and motivational states.
By expressing center zone activity as a proportion of total trial time, researchers gain a metric that is resistant to session variability and more readily comparable across time, treatment, and model conditions. This normalized measure enhances reproducibility and statistical power, particularly in multi-cohort or cross-laboratory designs.
For experimental designs aimed at assessing anxiety, exploratory strategy, or affective state, the percentage of time spent in the center offers one of the most robust and interpretable measures available in the Open Field Test.
Written by researchers, for researchers — powered by Conduct Science.


Monday – Friday
9 AM – 5 PM EST
DISCLAIMER: ConductScience and affiliate products are NOT designed for human consumption, testing, or clinical utilization. They are designed for pre-clinical utilization only. Customers purchasing apparatus for the purposes of scientific research or veterinary care affirm adherence to applicable regulatory bodies for the country in which their research or care is conducted.