

The Calvin(-Benson-Bassham) (CBB) cycle, also named reductive pentose phosphate pathway or dark reactions, is a group of biochemical reactions in photoautotrophs.
These reactions form the light-independent stage of photosynthesis, where the energy converted from light is used to assimilate carbon dioxide from the atmosphere.
The fixed carbon molecules are incorporated into carbohydrates, which are consumed by the heterotrophs. The carbohydrate intermediates produced during the Calvin cycle can also be converted to precursors of proteins and lipids that also feed consumers in the food chain.
Photosynthesis in eukaryotic organisms such as cyanobacteria, green algae, and plants occurs in chloroplasts and can be divided into light-dependent and independent stages.
The light-dependent reactions begin when photoreceptors in the thylakoid membrane capture photons, energy from sunlight. The solar energy excites electrons in photoreceptors clustered into photosystems I and II (PSI and II).
The excited electrons go through the electron transport chain, reducing nicotinamide adenine dinucleotide phosphate (NADP+) into NADPH and oxidizing water into oxygen.
During the transfer of electrons, proton gradients are generated across the thylakoid membrane, leading to adenosine triphosphate (ATP) synthesis in the stroma; this process is called photophosphorylation.
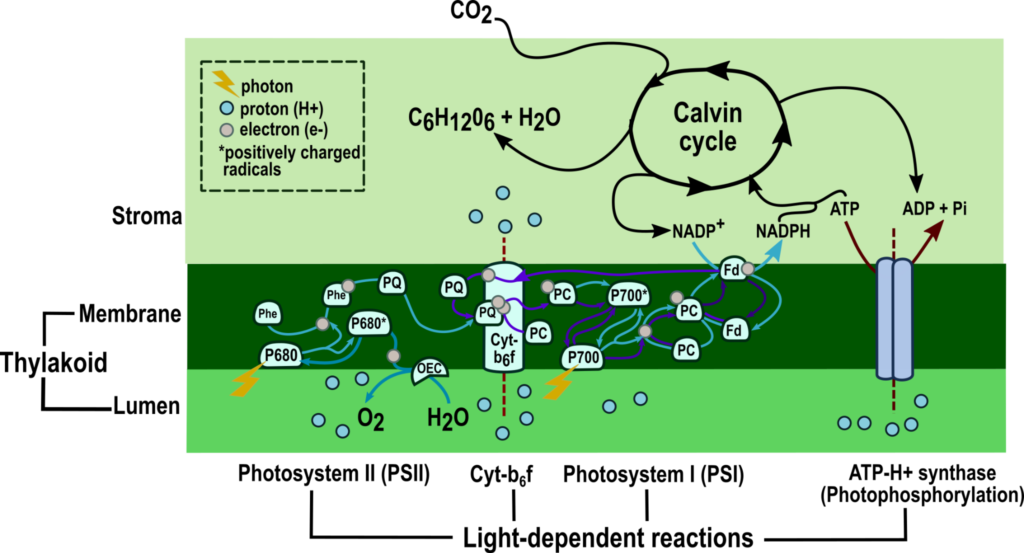
Figure 1: The two stages of photosynthesis: light-dependent reactions and the Calvin cycle.
(Source: Modified from Boyer, 2006 and Heldt, 2005).[1,2]
The second stage of photosynthesis occurs in a repeated set of biochemical reactions called the Calvin-Benson-Bassham or Calvin cycle, dark reactions, or the reductive pentose phosphate pathway (named after the cycle’s first substrate, a pentose phosphate).
The cycle starts by capturing atmospheric carbon dioxide (CO2), incorporating it into a five-carbon substrate, thus resulting in a six-carbon intermediate. Subsequently, ATP and NADPH generated during the light-dependent reactions are consumed to transform the six-carbon product into two molecules of a three-carbon phosphate sugar (triose phosphate).
A fraction of the triose phosphate is transported to the cytoplasm for carbohydrate synthesis – the final product of photosynthesis. Most of the triose phosphate molecules remain in the chloroplast so that they are used to regenerate the first substrate of the Calvin cycle – they leave the chloroplast only after they’ve been converted to DHAP.
NB: ADP and NADP+ from energy-consuming reactions are recycled to the light-dependent reactions so that they can participate in the electron transfer process.[1,2]

Figure 2: Overview of the Calvin cycle (Source: Mike Jones User: Adenosine, CC BY-SA 2.5 <https://creativecommons.org/licenses/by-sa/2.5>, via Wikimedia Commons).
Despite the name dark reactions, the Calvin cycle does not necessarily occur in the dark.
In fact, the Calvin cycle is coupled with water oxidation, the last electron transfer reaction in PSII that occurs after the capture of sunlight energy. Electron transfer helps generate NADPH and ATP, which are used in the Calvin cycle.
Therefore, the Calvin cycle is more likely to happen during daylight after the light-dependent stage has sufficiently produced NADPH and ATP.
The biochemical reactions in the Calvin cycle can be grouped into three phases based on their tasks:
Also known as the carboxylation phase, the first step in the Calvin cycle comprises only one irreversible reaction catalyzed by the enzyme ribulose-1,5-bisphosphate carboxylase/oxygenase (RubisCO). Read how enzymes are able to act as biocatalysts.
Here, atmospheric carbon dioxide (CO2) is fixed and incorporated into a five-carbon pentose phosphate, ribulose-1,5-bisphosphate (RuBP). The reaction produces a highly reactive six-carbon keto acid intermediate, 2-carboxy 3-keto arabinitol 1,5-bisphosphate.
The intermediate is hydrolyzed and split in half to yield two 3-phosphoglycerate (3PGA) molecules ultimately. Each is then subjected to successive reactions in the Calvin cycle and transformed into phosphate sugars.
RubisCo is the most abundant enzyme on Earth and the only one capable of fixing CO2 from the atmosphere. Thus, the rate of carbon fixation is considerably slow, which is thought to be the reason behind its large quantity in photosynthetic tissue.
Hence, RubisCo-catalyzed carboxylation acts as both the rate-limiting and committed step of the Calvin cycle.[2,3]
Apart from CO2, RubisCo also captures atmospheric oxygen (O2) and assimilates it to RuBP during photorespiration.
Instead of two 3PGA molecules, RubisCo-catalyzed oxygen condensation produces one 3PGA and another two-carbon molecule, 2–phosphoglycolate (2PGC).
The 3PGA molecule produced from photorespiration can supply the Calvin cycle in a similar manner to those produced from carbon fixation. However, the two-carbon product, 2PGC, must be translocated and modified before re-entering the chloroplast and converted to 3PGA before the fixed oxygen molecule can participate in the Calvin cycle.[2]
Each 3PGA generated from carbon fixation undergoes successive reduction reactions so that it is transformed into a triose phosphate (C3H7O6P). The three-carbon sugar phosphate can serve as a precursor in the biosynthesis of carbohydrates and the regeneration of RuBP in the last phase of the CBB cycle.
The transformation of 3PGA to triose phosphate occurs in two steps:
This first step in 3PGA transformation is catalyzed by the enzyme 3-phosphoglycerate kinase. The reaction dephosphorylates ATP and produces 1,3-bisphosphoglycerate (BPG), ADP and inorganic phosphate.
This second step in 3PGA transformation is catalyzed by NADP-glyceraldehyde 3-phosphate dehydrogenase. The carboxylic acid phospho-anhydride portion of the BPG reacts with the thiol group in the active center of the enzyme, resulting in the formation of a thioester bond. Subsequently, the thioester bond is hydrolyzed to form the product glyceraldehyde 3-phosphate (G3P).
Thioester bond hydrolysis requires a substantial amount of energy and is coupled with the oxidation of NADPH to NAPD+. Thus, the generation of G3P from BPG reduction is irreversible.
Thus, the reduction phase of the cycle can be summarized into:[2]
3PGA + ATP + NADPH —> Triose phosphate (G3P ⇌ DHAP)
Combined with the carbon fixation, both stages can be summarized into:
RuBP + CO2 + ATP + NADPH —> Triose phosphate (G3P ⇌ DHAP)
G3P is the first synthesized triose phosphate and it is converted to its isomer by the enzyme triose phosphate isomerase into dihydroxyacetone phosphate (DHAP). Both G3P and DHAP contain three-carbon atoms, and DHAP is more favorable in the equilibrium than G3P.[2]
One-sixth of the synthesized triose phosphate (G3P and DHAP) is used as precursors in the biosynthesis of sugar and starch.
When two triose phosphate molecules are available, they condense, forming a six-carbon molecule, fructose-1,6-bisphosphate (FBP). It is subsequently hydrolyzed into fructose-6-phosphate, an isomer of glucose-6-phosphate that serves as one of the precursors in sugar, starch, and cellulose biosynthesis.[2]
Generally, starch is synthesized from triose phosphate that remains in the stroma during the day. Sugar and cellulose are synthesized after triose phosphate is transported to the cytosol via a specific transporter.[3]
In addition to sugar and starch, G3P and DHAP can be converted into amino acids and fatty acids, which are building blocks for proteins and lipids.
The majority of the triose phosphate remains in the stroma and undergoes several chemical rearrangement reactions. At the end of the regeneration phase, the carbon-fixing RuBP is regenerated and available to restart the cycle.
In this phase, the reactions consist of a series of aldol condensation, dephosphorylation, and transketolase reactions that lead to the generation of a five-carbon sugar-phosphate – ribulose-5-phosphate (Ru5P).
The steps include:[2,3]
The three-carbon triose phosphate is transformed into six-carbon fructose-6-phosphate (F6P) in two steps:
In this step, F6B can exit the CBB cycle to supply other metabolic pathways as per cellular needs.
F6B which remains in the CBB cycle participates in several transfers of carbon atoms so that it is transformed into a five-carbon pentose phosphate molecule, ribulose-5-phosphate (Ru5P).
The enzymes transketolase or aldolase can catalyze the transfer of carbon atoms. Transketolase moves the carbon atoms from the ketone portion of the donor molecule and adds them to the aldehyde group of the accepting molecules. Aldolase catalyzes the condensation between ketone and aldehyde molecules.
The following are the metabolites and the number of their carbon atoms generated from transketolase-catalyzed carbon transfer:
Erythrose-4-phosphate (E4P) is a four-carbon metabolite resulting from the removal of two carbon atoms from F6B, facilitated by the enzyme transketolase.
Xylulose-5-phosphate (X5P) is a five-carbon metabolite generated from two transketolase-dependent transfers.
The first X5P is synthesized from the transfer of two carbon atoms from F6B to the three-carbon triose phosphate, G3P.
Later on, another X5P is generated in a similar manner. However, the two carbon atoms are from the ketone group of a seven-carbon metabolite, sedoheptulose-7-phosphate (S7P).
X5P is a Ru5P epimer and can be converted to Ru5P by the enzyme ribulose phosphate epimerase.
Sedoheptulose-1,7-bisphosphate (SBP) and sedoheptulose-7-phosphate (S7P) are seven-carbon metabolites in the light-independent stage of photosynthesis.
SBP is generated from the transfer of DHAP, the three-carbon metabolite, to the four-carbon metabolite, E4P, which is catalyzed by transaldolase.
S7P is subsequently generated from the irreversible dephosphorylation of SBP, catalyzed by the enzyme sedoheptulose-1,7-bisphosphatase.
Ribose-5-phosphate (R5P) is a five-carbon metabolite that is the residual from the transfer of two carbon atoms from S7P to G3P to form X5P.
R5P is a Ru5P isomer and can be converted to Ru5P by the enzyme ribose phosphate isomerase.
Thus, the processes in the generation of Ru5P can be summarized into:[2]
FBP + 2G3P + DHAP + 2H2O —> 2X5P + R5P + 2Pi
The two water molecules are used in the hydrolysis of FBP into F6P and SBP into S7P, which also produces two inorganic phosphates. X5P and R5P are enzymatically converted into Ru5P.
Thus, three Ru5P (3×5 carbon atoms) are generated from five molecules of triose phosphate (5×3 carbon atoms), two of which are condensed into FBP in the previous step of the regeneration phase.
In the last step of the regeneration phase, Ru5P is irreversibly phosphorylated by the enzyme ribulose phosphate kinase. The reaction consumes ATP and transforms Ru5P into ribulose-1,5-bisphosphate (RuBP).
RuBP synthesized at the end of the regeneration phase replenishes the RuBP in CO2 fixation. If ATP and NADPH are available, the regenerated RuBP will be consumed in the next round of the cycle.
The regeneration phase can be summarized into the following equation:[3]
5 Triose phosphate + 3ATP + 2H2O —> 3RuBP + 3ADP + 3Pi
Based on the summarized equation, three RuBP molecules are regenerated from five molecules of triose phosphate, which, based on the previous stages are from three rounds of CO2 fixation.
Rubisco-catalyzed CO2 fixation and assimilation into RuBP results in two 3PGA. Each consumes one ATP and NADPH and transforms into a triose phosphate (C3H7O6P) molecule. One-sixth of the triose phosphates produced by the cycle is used in carbohydrate synthesis pathways, while the rest remains and enters the regeneration phase.
Thus, the overall Calvin cycle can be summarized into:[3]
3CO2 + 5H20 + 9ATP + 6NADPH —> C3H7O6P + 9ADP + 9Pi + 6NADP+
Since ADP, inorganic phosphates, and NADP+ eventually resupply the light reactions, it can be concluded that the many biochemical reactions in the dark reaction contribute only one product to photosynthesis, a three-carbon triose phosphate, glyceraldehyde 3-phosphate (G3P). Two or more of the G3P molecules are subsequently used to synthesize starch and sugar.
The Calvin cycle starts with RubisCo-fixation of atmospheric CO2 and assimilation into a five-carbon ribulose-1,6-bisphosphate (RuBP), followed by a reduction phase, and the regeneration of its carbon-accepting substrate, RuBP.
Along the way, a fraction of the three-carbon product, glyceraldehyde 3-phosphate (G3P), leaves the cycle and serves as precursors in the biosynthesis of sugar and starch.
It marks the second stage of photosynthesis when ATP and NADPH produced during the first stage are consumed to set the stage for carbohydrate synthesis. And of course, it also enables photosynthesis to provide food and raw materials to heterotrophs in the ecosystem.
In behavioral neuroscience, the Open Field Test (OFT) remains one of the most widely used assays to evaluate rodent models of affect, cognition, and motivation. It provides a non-invasive framework for examining how animals respond to novelty, stress, and pharmacological or environmental manipulations. Among the test’s core metrics, the percentage of time spent in the center zone offers a uniquely normalized and sensitive measure of an animal’s emotional reactivity and willingness to engage with a potentially risky environment.
This metric is calculated as the proportion of time spent in the central area of the arena—typically the inner 25%—relative to the entire session duration. By normalizing this value, researchers gain a behaviorally informative variable that is resilient to fluctuations in session length or overall movement levels. This makes it especially valuable in comparative analyses, longitudinal monitoring, and cross-model validation.
Unlike raw center duration, which can be affected by trial design inconsistencies, the percentage-based measure enables clearer comparisons across animals, treatments, and conditions. It plays a key role in identifying trait anxiety, avoidance behavior, risk-taking tendencies, and environmental adaptation, making it indispensable in both basic and translational research contexts.
Whereas simple center duration provides absolute time, the percentage-based metric introduces greater interpretability and reproducibility, especially when comparing different animal models, treatment conditions, or experimental setups. It is particularly effective for quantifying avoidance behaviors, risk assessment strategies, and trait anxiety profiles in both acute and longitudinal designs.
This metric reflects the relative amount of time an animal chooses to spend in the open, exposed portion of the arena—typically defined as the inner 25% of a square or circular enclosure. Because rodents innately prefer the periphery (thigmotaxis), time in the center is inversely associated with anxiety-like behavior. As such, this percentage is considered a sensitive, normalized index of:
Critically, because this metric is normalized by session duration, it accommodates variability in activity levels or testing conditions. This makes it especially suitable for comparing across individuals, treatment groups, or timepoints in longitudinal studies.
A high percentage of center time indicates reduced anxiety, increased novelty-seeking, or pharmacological modulation (e.g., anxiolysis). Conversely, a low percentage suggests emotional inhibition, behavioral avoidance, or contextual hypervigilance. reduced anxiety, increased novelty-seeking, or pharmacological modulation (e.g., anxiolysis). Conversely, a low percentage suggests emotional inhibition, behavioral avoidance, or contextual hypervigilance.
The percentage of center time is one of the most direct, unconditioned readouts of anxiety-like behavior in rodents. It is frequently reduced in models of PTSD, chronic stress, or early-life adversity, where animals exhibit persistent avoidance of the center due to heightened emotional reactivity. This metric can also distinguish between acute anxiety responses and enduring trait anxiety, especially in longitudinal or developmental studies. Its normalized nature makes it ideal for comparing across cohorts with variable locomotor profiles, helping researchers detect true affective changes rather than activity-based confounds.
Rodents that spend more time in the center zone typically exhibit broader and more flexible exploration strategies. This behavior reflects not only reduced anxiety but also cognitive engagement and environmental curiosity. High center percentage is associated with robust spatial learning, attentional scanning, and memory encoding functions, supported by coordinated activation in the prefrontal cortex, hippocampus, and basal forebrain. In contrast, reduced center engagement may signal spatial rigidity, attentional narrowing, or cognitive withdrawal, particularly in models of neurodegeneration or aging.
The open field test remains one of the most widely accepted platforms for testing anxiolytic and psychotropic drugs. The percentage of center time reliably increases following administration of anxiolytic agents such as benzodiazepines, SSRIs, and GABA-A receptor agonists. This metric serves as a sensitive and reproducible endpoint in preclinical dose-finding studies, mechanistic pharmacology, and compound screening pipelines. It also aids in differentiating true anxiolytic effects from sedation or motor suppression by integrating with other behavioral parameters like distance traveled and entry count (Prut & Belzung, 2003).
Sex-based differences in emotional regulation often manifest in open field behavior, with female rodents generally exhibiting higher variability in center zone metrics due to hormonal cycling. For example, estrogen has been shown to facilitate exploratory behavior and increase center occupancy, while progesterone and stress-induced corticosterone often reduce it. Studies involving gonadectomy, hormone replacement, or sex-specific genetic knockouts use this metric to quantify the impact of endocrine factors on anxiety and exploratory behavior. As such, it remains a vital tool for dissecting sex-dependent neurobehavioral dynamics.
The percentage of center time is one of the most direct, unconditioned readouts of anxiety-like behavior in rodents. It is frequently reduced in models of PTSD, chronic stress, or early-life adversity. Because it is normalized, this metric is especially helpful for distinguishing between genuine avoidance and low general activity.
Environmental Control: Uniformity in environmental conditions is essential. Lighting should be evenly diffused to avoid shadow bias, and noise should be minimized to prevent stress-induced variability. The arena must be cleaned between trials using odor-neutral solutions to eliminate scent trails or pheromone cues that may affect zone preference. Any variation in these conditions can introduce systematic bias in center zone behavior. Use consistent definitions of the center zone (commonly 25% of total area) to allow valid comparisons. Software-based segmentation enhances spatial precision.
Evaluating how center time evolves across the duration of a session—divided into early, middle, and late thirds—provides insight into behavioral transitions and adaptive responses. Animals may begin by avoiding the center, only to gradually increase center time as they habituate to the environment. Conversely, persistently low center time across the session can signal prolonged anxiety, fear generalization, or a trait-like avoidance phenotype.
To validate the significance of center time percentage, it should be examined alongside results from other anxiety-related tests such as the Elevated Plus Maze, Light-Dark Box, or Novelty Suppressed Feeding. Concordance across paradigms supports the reliability of center time as a trait marker, while discordance may indicate task-specific reactivity or behavioral dissociation.
When paired with high-resolution scoring of behavioral events such as rearing, grooming, defecation, or immobility, center time offers a richer view of the animal’s internal state. For example, an animal that spends substantial time in the center while grooming may be coping with mild stress, while another that remains immobile in the periphery may be experiencing more severe anxiety. Microstructure analysis aids in decoding the complexity behind spatial behavior.
Animals naturally vary in their exploratory style. By analyzing percentage of center time across subjects, researchers can identify behavioral subgroups—such as consistently bold individuals who frequently explore the center versus cautious animals that remain along the periphery. These classifications can be used to examine predictors of drug response, resilience to stress, or vulnerability to neuropsychiatric disorders.
In studies with large cohorts or multiple behavioral variables, machine learning techniques such as hierarchical clustering or principal component analysis can incorporate center time percentage to discover novel phenotypic groupings. These data-driven approaches help uncover latent dimensions of behavior that may not be visible through univariate analyses alone.
Total locomotion helps contextualize center time. Low percentage values in animals with minimal movement may reflect sedation or fatigue, while similar values in high-mobility subjects suggest deliberate avoidance. This metric helps distinguish emotional versus motor causes of low center engagement.
This measure indicates how often the animal initiates exploration of the center zone. When combined with percentage of time, it differentiates between frequent but brief visits (indicative of anxiety or impulsivity) versus fewer but sustained center engagements (suggesting comfort and behavioral confidence).
The delay before the first center entry reflects initial threat appraisal. Longer latencies may be associated with heightened fear or low motivation, while shorter latencies are typically linked to exploratory drive or low anxiety.
Time spent hugging the walls offers a spatial counterbalance to center metrics. High thigmotaxis and low center time jointly support an interpretation of strong avoidance behavior. This inverse relationship helps triangulate affective and motivational states.
By expressing center zone activity as a proportion of total trial time, researchers gain a metric that is resistant to session variability and more readily comparable across time, treatment, and model conditions. This normalized measure enhances reproducibility and statistical power, particularly in multi-cohort or cross-laboratory designs.
For experimental designs aimed at assessing anxiety, exploratory strategy, or affective state, the percentage of time spent in the center offers one of the most robust and interpretable measures available in the Open Field Test.
Written by researchers, for researchers — powered by Conduct Science.


Monday – Friday
9 AM – 5 PM EST
DISCLAIMER: ConductScience and affiliate products are NOT designed for human consumption, testing, or clinical utilization. They are designed for pre-clinical utilization only. Customers purchasing apparatus for the purposes of scientific research or veterinary care affirm adherence to applicable regulatory bodies for the country in which their research or care is conducted.