


As an Amazon Associate, ConductScience Inc. earns revenue from qualifying purchases
Centrifugation is a laboratory technique routinely used to fractionate a given liquid mixture into single components. The basis of the technique is the application of centripetal forces to a sample by spinning it at high velocity.
As a consequence, a centrifugal force originates in the opposite direction. A detailed description of the fundamental principles of centrifugation can be found in our article on centrifugation.
The equilibrium between the two forces, together with the size and density of the particles in the solution, determines the extension of particle migration, in such a way that it is dependent on the tube position in the centrifuge’s rotor (Figure 1).
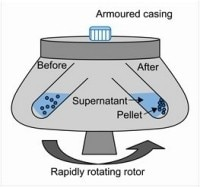
Figure 1: Schematic representation of a centrifuge rotor and sample positioning before and after centrifugation (image credit: fisherscientific).
Different centrifuges are available on the market, specifically designed for certain applications. In general, centrifuges are sold with a range of accessories, that can be used depending on the goal of a particular centrifugation protocol.
The centrifuge rotor is an essential element of the device, which determines not only the sample size but also how the particles migrate and distribute in solution after centrifugation. Some centrifuges come with more than one rotor, widening the scope of their applications (Figure 2). Older centrifuges, however, are sold with only one undetachable rotor (Biocompare, 2019).
In this article, you will learn about the different centrifuge rotors, how to choose between the myriad of market offers, and how to properly maintain them, to assure a functional, accurate, and long-lived centrifuge in your laboratory.
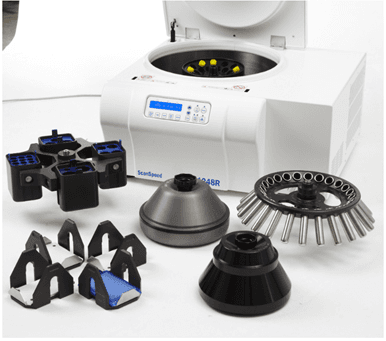
Figure 2: A multipurpose high-speed refrigerated centrifuge with a wide range of rotors, buckets, and adaptors (image credit: Labogene)
Depending on the application, the centrifugal forces generated in laboratory centrifuges can vary from a few hundred g up to 1 000 000 × g (Biocompare, 2019).
Accordingly, centrifuge rotors are made from different materials. Low-speed rotors are usually made of steel or brass, while high-speed rotors consist of aluminum, titanium, or fiber-reinforced composites. The exterior of specific rotors might be finished with protective paints.
For example, rotors for ultracentrifugation made out of titanium alloy are covered with a polyurethane layer and aluminum rotors are protected from corrosion by a tough, electrochemically formed layer of aluminum oxide (Table 1) (Ohlendieck & Harding, 2017).
Table 1: Comparison of rotor materials
| Aluminum | Titanium | Carbon Fiber |
|---|---|---|
|
Highly susceptible to acid, alkali, or salt corrosion |
Moderately susceptible to acid, alkali, or salt corrosion |
(1) Corrosion-free
(2) No deration due to high strength to weight ratio of rotor materials |
|
Anodizing may lead to stress corrosion |
May require deration due to repeated run cycles |
(1) No stretching or elongation during centrifugation (2) Lightweight |
|
Heavy material; uses increased energy to spin |
Heavy material; uses increased energy to spin |
(1) Heat insulating maintains sample temperature (2) Environmentally-friendly production process |
Griffith O.M., in Practical Techniques for Centrifugal Separations, by ThermoFischer)
For a wide range of routine applications, the standard benchtop and clinical centrifuges may present one of the following types of rotors (Ohlendieck & Harding, 2017):
Available for purchase here. During centrifugation, the rotor buckets swing out in the same direction of the centrifugal force, elevating the sample up to 90º relative to the rotation axis (Figure 3).
This type of rotor is mainly used for rate zonal centrifugation, i.e., to separate particles as a function of their size and density, in which the maximum resolution in particle separation is needed (Ohlendieck, 2017).
Swinging-bucket rotors are also suitable for isopycnic centrifugation, i.e., separation based on density only. However, to attain maximum particle separation, the centrifugation process may be too time-consuming.
Given that during centrifugation, tubes reach a 90ºC angle, the overall particle migration distance is higher than in fixed-angle rotors. As particles with small sizes migrate to the complete extension of the sample tube, the time to reach the tube bottom is higher than fixed-angle or vertical-tube rotors.
Advantages: Higher separation resolution; adaptable to different sample containers and volumes (e.g., plates, 15mL tubes, 50 mL tubes and bottles)
Disadvantages: Longer centrifugation times; lower number of tubes per run than fixed-angle rotors
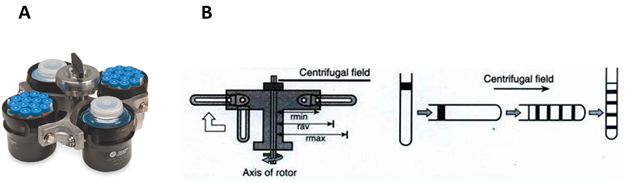
Figure 3: (A) example of a swinging-bucket rotor (image credit: Beckman Coulter Life Sciences); (B) Schematic representation of the centrifugal field and particle movement in swinging-bucket rotors (image credit: microbionotes).
Available for purchase here. Tubes are held in a fixed position (usually 45º) relative to the rotational axis. Because of that, particles migrate in a downward spiral manner, and sediment in the bottom of the tube. Smaller rotor angles result in more diffuse sediment (pellet).
Fixed-angle rotors are suitable for the fractionation of samples in which the sedimentation rates of the different components differ significantly, such as the separation of cellular components like mitochondria, cell nuclei, and cytoplasmic content (Ohlendieck & Harding, 2017).
Advantages:
Disadvantages:
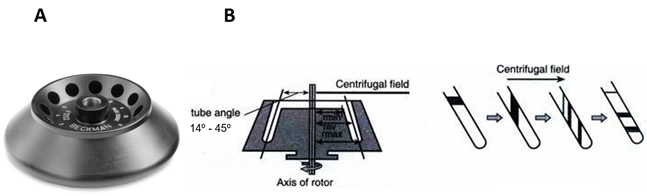
Figure 3: (A) example of a fixed-angle rotor (image credit: Beckman Coulter Life Sciences); (B) Schematic representation of the centrifugal field and particle movement in swinging-bucket rotors (image credit: microbionotes).
Tubes are held between 0º – 9º from the axis of rotation, which represents the shortest radial distance, and therefore the shortest pathlength for particles during centrifugation. In vertical and near-vertical rotors, particles sediment throughout the wall of the tube. Due to the shorter radial distance, centrifugation time is reduced, which may be important for certain biological samples.
However, the particle separation resolution is significantly reduced: during centrifugation, particles sediment through the tube wall, however, when the rotor deaccelerates and stops, the sedimented particles fall off the tube wall and contaminate the separated sample zones (Griffith, 2010; Ohlendieck & Harding, 2017).
Advantages: Shorter run times.
Disadvantages: Low particle separation resolution.
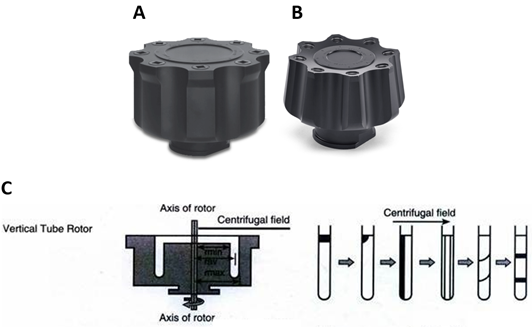
Figure 3: (A) example of a vertical rotor; (B) example of a near-vertical rotor (image credit: Beckman Coulter Life Sciences); C. Schematic representation of the centrifugal field and particle movement in swinging-bucket rotors (image credit: microbionotes).
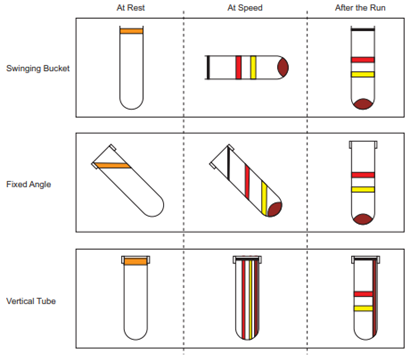
Figure 4: Sample orientation in Swinging-bucket, fixed-angle, and vertical-tube rotors (image credit: Griffith O.M., in Practical Techniques for Centrifugal Separations, by ThermoFischer)
They are used to process large volumes of samples with high centrifugal forces, in a less time-consuming manner, as their use avoids start-and-stop to consecutively decant the supernatant. This type of rotor is used to recover large volumes of biological components such as viruses, mitochondria, bacteria, and algae.
Advantages:
Disadvantages:
They are similar to continuous flow rotors but suitable for differential centrifugation, as they allow for density gradient solutions to be loaded prior to the target solution (Plüisch, Bössenecker, Doblera, & Wittemann, 2019; Spragg, 1978).
Zonal rotors are used for large-scale zonal centrifugation, recovering the sample components as bands in a gradient.
Advantages:
Disadvantages:
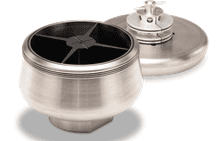
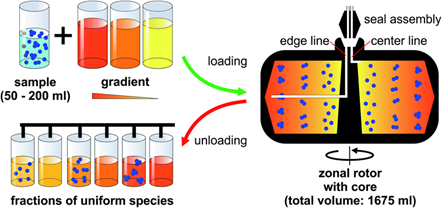
Figure 4 (A) Example of a zonal rotor (image credit: Beckman Coulter Life Sciences); (B) Zonal rotor centrifugation: a density gradient is introduced at the edge of a hollow rotor, while it is spinning at reduced speed. Loading starts with the lightest portion of the gradient first, followed by layers of increasing densities.
Once the gradient fills the rotor completely, the sample suspension is introduced at the rotor core as the last material loaded. Separation is accomplished by sorting the particles according to their sedimentation coefficients.
At the end of the centrifuge run, the rotor speed is reduced and its content is displaced out through the center exit by pumping a sufficiently dense solution into the edge line. Suspensions of sorted nanoparticles can be picked up using a fraction collector system (Plüisch et al., 2019).
They are specially designed for pelleting small particles such as viruses and proteins. The rotor is supplied and driven by a pressurized air source. Rotor speed can be determined by the conversion of the applied air pressure to rotations per minute (rpm).
Importantly, the deceleration process is very slow to avoid a mixture of the sample components. Airfuge rotors are held in place by a pressure differential created by the applied centrifugation force, which makes these rotors extremely safe. Furthermore, in Airfuge centrifuges, a filter is supplied with the ultracentrifuge for water and oil removal from the air supply.
Advantages:
Disadvantages:
Special Maintenance:
Analytical ultracentrifugation combines high-speed centrifugation with optical detection systems to observe particle separation in real-time. Therefore, AUC rotors must allow light to reach the sample.
Advantages:
Disadvantages:
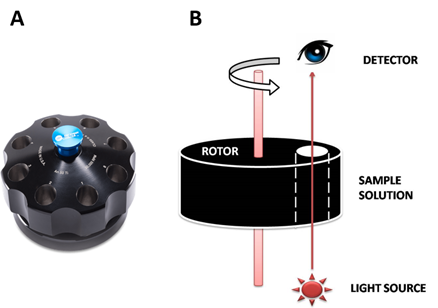
Figure 5: (A). Example of an analytical ultracentrifugation rotor (image credit: Beckman Coulter Life Sciences); (B). Schematic representation of the centrifugal field and particle movement in swinging-bucket rotors (image credit: Institute of Molecular Biophysics, Florida State University).
They are designed to concentrate monodisperse solutions of single cells or particles, according to their size. Elutriation rotors combine centrifugal force and fluid velocity, two forces that affect particle migration. Centrifugal force drives articles away from the rotational axis, while fluid velocity drives them in the opposite direction – counterflow elutriation (Figure 6).
Advantages:
Disadvantages:
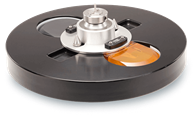
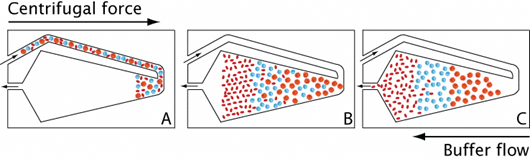
Figure 6: An example of an elutriation rotor (image credit: Beckman Coulter Life Sciences); B. Cell separation using counter-current elutriation. (A) Cells are fed into a spinning rotor, where the centrifugal force is balanced by a counter-directed buffer flow. (B) Depending on size, cells are differentially affected by the centrifugal force and separation occurs. (C) By slowly increasing the flow rate, fractions of cells of well-defined sizes can be recovered. Image credit: (Thorén, 2007).
(Goodman, 2007)
Rotor care and maintenance are essential for ensuring the safety and longevity of rotors and centrifuges. In general, the same maintenance and care principles apply to all of the rotors mentioned in this article.
The key component of centrifuges is the rotor, which determines the sample volume and the type of particle separation. Nowadays, there are, in the market, several options that allow the researcher to choose the optimal rotor, suitable for specific applications.
The main disadvantages of certain types of rotors are the limited sample capacity and, in some cases, the elevated cost. Therefore, it is important to keep appropriate care and maintenance, to ensure a proper long-lived functional device.
In behavioral neuroscience, the Open Field Test (OFT) remains one of the most widely used assays to evaluate rodent models of affect, cognition, and motivation. It provides a non-invasive framework for examining how animals respond to novelty, stress, and pharmacological or environmental manipulations. Among the test’s core metrics, the percentage of time spent in the center zone offers a uniquely normalized and sensitive measure of an animal’s emotional reactivity and willingness to engage with a potentially risky environment.
This metric is calculated as the proportion of time spent in the central area of the arena—typically the inner 25%—relative to the entire session duration. By normalizing this value, researchers gain a behaviorally informative variable that is resilient to fluctuations in session length or overall movement levels. This makes it especially valuable in comparative analyses, longitudinal monitoring, and cross-model validation.
Unlike raw center duration, which can be affected by trial design inconsistencies, the percentage-based measure enables clearer comparisons across animals, treatments, and conditions. It plays a key role in identifying trait anxiety, avoidance behavior, risk-taking tendencies, and environmental adaptation, making it indispensable in both basic and translational research contexts.
Whereas simple center duration provides absolute time, the percentage-based metric introduces greater interpretability and reproducibility, especially when comparing different animal models, treatment conditions, or experimental setups. It is particularly effective for quantifying avoidance behaviors, risk assessment strategies, and trait anxiety profiles in both acute and longitudinal designs.
This metric reflects the relative amount of time an animal chooses to spend in the open, exposed portion of the arena—typically defined as the inner 25% of a square or circular enclosure. Because rodents innately prefer the periphery (thigmotaxis), time in the center is inversely associated with anxiety-like behavior. As such, this percentage is considered a sensitive, normalized index of:
Critically, because this metric is normalized by session duration, it accommodates variability in activity levels or testing conditions. This makes it especially suitable for comparing across individuals, treatment groups, or timepoints in longitudinal studies.
A high percentage of center time indicates reduced anxiety, increased novelty-seeking, or pharmacological modulation (e.g., anxiolysis). Conversely, a low percentage suggests emotional inhibition, behavioral avoidance, or contextual hypervigilance. reduced anxiety, increased novelty-seeking, or pharmacological modulation (e.g., anxiolysis). Conversely, a low percentage suggests emotional inhibition, behavioral avoidance, or contextual hypervigilance.
The percentage of center time is one of the most direct, unconditioned readouts of anxiety-like behavior in rodents. It is frequently reduced in models of PTSD, chronic stress, or early-life adversity, where animals exhibit persistent avoidance of the center due to heightened emotional reactivity. This metric can also distinguish between acute anxiety responses and enduring trait anxiety, especially in longitudinal or developmental studies. Its normalized nature makes it ideal for comparing across cohorts with variable locomotor profiles, helping researchers detect true affective changes rather than activity-based confounds.
Rodents that spend more time in the center zone typically exhibit broader and more flexible exploration strategies. This behavior reflects not only reduced anxiety but also cognitive engagement and environmental curiosity. High center percentage is associated with robust spatial learning, attentional scanning, and memory encoding functions, supported by coordinated activation in the prefrontal cortex, hippocampus, and basal forebrain. In contrast, reduced center engagement may signal spatial rigidity, attentional narrowing, or cognitive withdrawal, particularly in models of neurodegeneration or aging.
The open field test remains one of the most widely accepted platforms for testing anxiolytic and psychotropic drugs. The percentage of center time reliably increases following administration of anxiolytic agents such as benzodiazepines, SSRIs, and GABA-A receptor agonists. This metric serves as a sensitive and reproducible endpoint in preclinical dose-finding studies, mechanistic pharmacology, and compound screening pipelines. It also aids in differentiating true anxiolytic effects from sedation or motor suppression by integrating with other behavioral parameters like distance traveled and entry count (Prut & Belzung, 2003).
Sex-based differences in emotional regulation often manifest in open field behavior, with female rodents generally exhibiting higher variability in center zone metrics due to hormonal cycling. For example, estrogen has been shown to facilitate exploratory behavior and increase center occupancy, while progesterone and stress-induced corticosterone often reduce it. Studies involving gonadectomy, hormone replacement, or sex-specific genetic knockouts use this metric to quantify the impact of endocrine factors on anxiety and exploratory behavior. As such, it remains a vital tool for dissecting sex-dependent neurobehavioral dynamics.
The percentage of center time is one of the most direct, unconditioned readouts of anxiety-like behavior in rodents. It is frequently reduced in models of PTSD, chronic stress, or early-life adversity. Because it is normalized, this metric is especially helpful for distinguishing between genuine avoidance and low general activity.
Environmental Control: Uniformity in environmental conditions is essential. Lighting should be evenly diffused to avoid shadow bias, and noise should be minimized to prevent stress-induced variability. The arena must be cleaned between trials using odor-neutral solutions to eliminate scent trails or pheromone cues that may affect zone preference. Any variation in these conditions can introduce systematic bias in center zone behavior. Use consistent definitions of the center zone (commonly 25% of total area) to allow valid comparisons. Software-based segmentation enhances spatial precision.
Evaluating how center time evolves across the duration of a session—divided into early, middle, and late thirds—provides insight into behavioral transitions and adaptive responses. Animals may begin by avoiding the center, only to gradually increase center time as they habituate to the environment. Conversely, persistently low center time across the session can signal prolonged anxiety, fear generalization, or a trait-like avoidance phenotype.
To validate the significance of center time percentage, it should be examined alongside results from other anxiety-related tests such as the Elevated Plus Maze, Light-Dark Box, or Novelty Suppressed Feeding. Concordance across paradigms supports the reliability of center time as a trait marker, while discordance may indicate task-specific reactivity or behavioral dissociation.
When paired with high-resolution scoring of behavioral events such as rearing, grooming, defecation, or immobility, center time offers a richer view of the animal’s internal state. For example, an animal that spends substantial time in the center while grooming may be coping with mild stress, while another that remains immobile in the periphery may be experiencing more severe anxiety. Microstructure analysis aids in decoding the complexity behind spatial behavior.
Animals naturally vary in their exploratory style. By analyzing percentage of center time across subjects, researchers can identify behavioral subgroups—such as consistently bold individuals who frequently explore the center versus cautious animals that remain along the periphery. These classifications can be used to examine predictors of drug response, resilience to stress, or vulnerability to neuropsychiatric disorders.
In studies with large cohorts or multiple behavioral variables, machine learning techniques such as hierarchical clustering or principal component analysis can incorporate center time percentage to discover novel phenotypic groupings. These data-driven approaches help uncover latent dimensions of behavior that may not be visible through univariate analyses alone.
Total locomotion helps contextualize center time. Low percentage values in animals with minimal movement may reflect sedation or fatigue, while similar values in high-mobility subjects suggest deliberate avoidance. This metric helps distinguish emotional versus motor causes of low center engagement.
This measure indicates how often the animal initiates exploration of the center zone. When combined with percentage of time, it differentiates between frequent but brief visits (indicative of anxiety or impulsivity) versus fewer but sustained center engagements (suggesting comfort and behavioral confidence).
The delay before the first center entry reflects initial threat appraisal. Longer latencies may be associated with heightened fear or low motivation, while shorter latencies are typically linked to exploratory drive or low anxiety.
Time spent hugging the walls offers a spatial counterbalance to center metrics. High thigmotaxis and low center time jointly support an interpretation of strong avoidance behavior. This inverse relationship helps triangulate affective and motivational states.
By expressing center zone activity as a proportion of total trial time, researchers gain a metric that is resistant to session variability and more readily comparable across time, treatment, and model conditions. This normalized measure enhances reproducibility and statistical power, particularly in multi-cohort or cross-laboratory designs.
For experimental designs aimed at assessing anxiety, exploratory strategy, or affective state, the percentage of time spent in the center offers one of the most robust and interpretable measures available in the Open Field Test.
Written by researchers, for researchers — powered by Conduct Science.


Monday – Friday
9 AM – 5 PM EST
DISCLAIMER: ConductScience and affiliate products are NOT designed for human consumption, testing, or clinical utilization. They are designed for pre-clinical utilization only. Customers purchasing apparatus for the purposes of scientific research or veterinary care affirm adherence to applicable regulatory bodies for the country in which their research or care is conducted.