

Lipids are one of the major macromolecules present in our body, and others include nucleic acids, carbohydrates, and proteins. But unlike the other macro biomolecules, lipids are not polymers – they aren’t composed of monomers. They are hydrophobic in nature because of the predominance of hydrocarbon chains (–CH2–CH2–CH2–CH2–) in their structures.[1]
Lipids have diverse roles in many key biological functions, such as acting as structural components of cell membranes, serving as energy storage sources, and participating in signaling pathways.
In 1665, Robert Boyle observed a milky appearance in animal’s blood collected after their feed. Later, the milky liquid was determined to contain fat, by Henson in 1774.[1] The 18th-19th century marks the era of extensive study of these molecules. And it was in 1827, that fat, along with carbohydrate and protein, were believed to be an essential nutrient for humans and animals.[1]
This article brings you the general structure, properties, classification, and functions of lipids in different organisms.
Lipids are defined as heterogeneous groups of organic molecules soluble in non-polar solvents. Structurally, they are esters or amides of fatty acids. This class includes a range of molecules, such as fats, oils, hormones, and certain components of membranes. These molecules are either non-soluble or are poorly soluble in water.
Lipids were first classified in 1815 by Henri Braconnot in two categories of solid grease and fluid oil.[3] But the true classification was proposed in 1947 by T. P. Hidlich, he divided the simple lipids into grease and waxes.[3]
Lipids can be classified in four ways, depending on:
Lipids based on chemical composition are divided into three categories: simple lipids, compound lipids, and derived lipids.
It includes esters of fatty acids and glycerol that are also termed neutral fats or triglycerides. They make up 98-99% of food and body fats and oil.[4] Its three classes are fatty acids, triglycerides, and waxes.
Fatty acids are the simplest form of lipids. They are a long chain of hydrocarbons (4 to 36 carbons long) with one carboxyl group.[4] These molecules serve as constituents in a large number of complex lipids. In biological systems, fatty acids contain an even number of carbon atoms. Among all fatty acids, 16-18 carbon fatty acids are the most common.[4]
Fatty acids are amphipathic, having both polar and nonpolar ends. The alkyl chains present in their structure can either be saturated or unsaturated.[4]
Given below is a chart of predominant fatty acids found in mammals:[4]
| S. No | Common Name | Systematic Name | No. of Carbon atoms | No. of double bonds |
|---|---|---|---|---|
|
1 |
Lauric acid |
Dodecanoic |
12 |
|
|
2 |
Myristic |
Tetradecanoic |
14 |
|
|
3 |
Palmitic |
Hexadecanoic |
16 |
|
|
4 |
Stearic |
Octadecanoic |
18 |
|
|
5 |
Palmitoleic |
Cis-Δ9-Hexadecenoic |
16 |
1 |
|
6 |
Oleic |
Cis-Δ9-Octadecenoic |
18 |
1 |
|
7 |
Linoleic |
All Cis-Δ9, Δ12-Octadecadienoic |
18 |
2 |
|
8 |
Linolenic |
All Cis-Δ9, Δ12, Δ15-Octadecatrienoic |
18 |
3 |
|
8 |
Arachidonic |
All Cis-Δ5, Δ8, Δ11, Δ14-Eicosatetraenoic |
20 |
4 |
Triacylglycerols (or triglycerides) are tri-esters of fatty acids and glycerol.[4] They are nonpolar and hydrophobic in nature. They do not possess any charge and are termed neutral lipids. Triacylglycerol contains varying lengths of fatty acids that can be saturated or unsaturated.[4]
The two types of triacylglycerols include simple and mixed types. The triglycerides containing only a single type of fatty acids are called simple triglycerides, while those with two or more different types of fatty acids are called mixed triglycerides.[4]
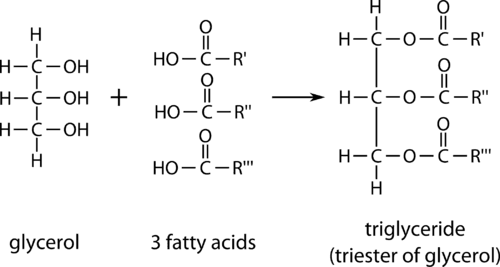
Image: Formation of triglyceride structure.
Source: chem.libretext.org.[5]
Waxes are esters of long-chain fatty acids and long-chain alcohol.[4] They are solid at room temperature and completely water-insoluble. They are formed by the esterification of long-chain fatty acids and monohydroxy alcohol of higher molecular weight. The popularly known beeswax contains triacontanyl palmitate as a major molecule.[4]
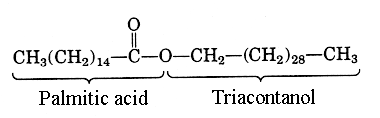
Image: The molecular structure of beeswax.
Source: Toppr.[6]
The hydrophobic nature of waxes allows them to function as water repellents on leaves of some plants, feathers, and cuticles of insects. They also serve as energy storage for planktons and higher aquatic animals.[4]
The complex or compound lipids contain some other organic molecules in addition to fatty acids and glycerols. They include phospholipids, glycolipids, and lipoproteins.[4]
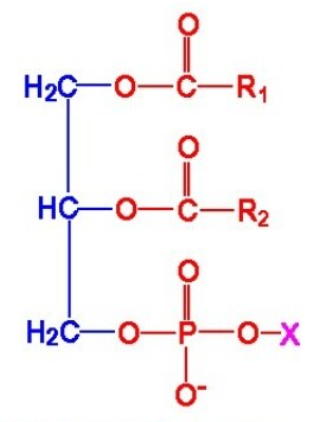
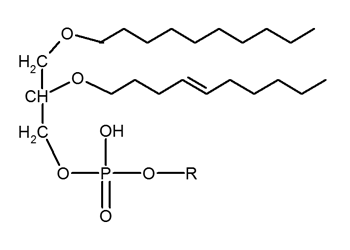
Image: A general structure of ether glycerophospholipids.
Source: Wikipedia.[8]
Sphingophospholipids are sphingosine (18-carbon containing amino alcohol) derived phospholipids.[4] Its parent structure consists of ceramide, which is a fatty acid joined to sphingosine via an amide linkage.

Image: The structure of ceramide.
Source: chem.latech.edu.[9]
One example of sphingophospholipids is sphingomyelin which is a major constituent of the nervous system in higher animals.[4]
Glycolipids contain a carbohydrate group (attached through a glycosidic bond) in combination with glycerol and fatty acids. It’s the third major class of membrane lipids.[4] The head group of the molecule contains sugar (one or more) connected directly to the hydroxyl group at C1 of the ceramide moiety.
Some examples of glycolipids are cerebroside that has a single sugar moiety attached to ceramide; globoside, having multiple sugar moiety attached to ceramide; and ganglioside, which is a globoside with the head group containing one or more residues of N-acetylneuraminic acid (sialic acid).[4] However, the normal function of ganglioside is still a topic of research.
Some diseases associated with sphingolipid storage are given below:[4]
| S. No | Disease | Accumulating sphingolipid | Enzyme deficiency |
|---|---|---|---|
|
1 |
Tay Sach |
Ganglioside GM2 |
Beta-hexosaminidase A |
|
2 |
Niemann Pack |
Sphingomyelin |
Sphingomyelinase |
|
3 |
Fabry’s |
Trihex Acyl Ceramide |
alpha-Galactosidase A |
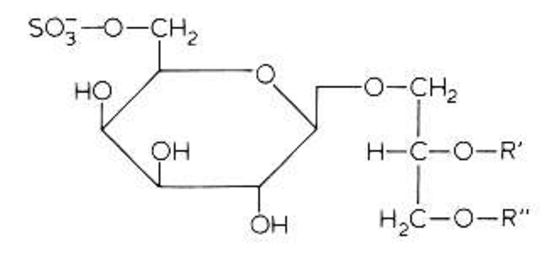
Image: The structure of glycolipids.
Source: Production and characterization of biosurfactant from bacterial isolates.[10]
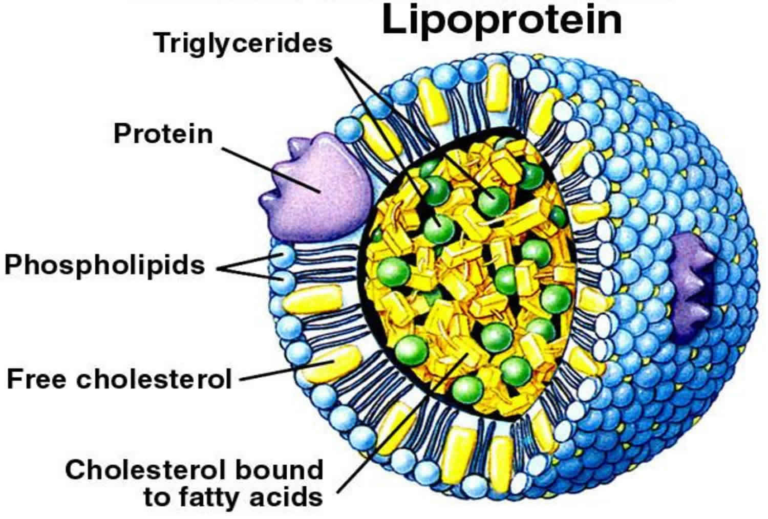
Lipoproteins are lipid-protein complexes. They help lipids derived from food or synthesized in one organ, such as triglycerides, phospholipids, cholesterol, and cholesterol esters, to be transported throughout the body.[4]
Lipoproteins soluble in the blood are categorized into four groups based on their densities:[4]
The lipoproteins have a core containing neutral lipids, triacylglycerols and cholesterol esters. The core is coated with a single layer of phospholipids, embedded with apolipoproteins and cholesterol.[11]
Derived lipids are released during hydrolysis of simple and compound lipids. They include steroids and some fatty acids.
Steroids consist of four fused rings called steroid nucleus. They are complex derivatives of triterpenes.[4] One example is cholesterol which is an essential component in animal cell membranes. It’s stored in cells as fatty acid esters and act as precursors for the biosynthesis of steroid hormones and bile salts.[4]
Cholesterol is absent in fungi and plants. Some other steroids that are common in plants include stigmasterol, sitosterol, and campesterol. In fungi, ergosterol is present in their cell membrane.[4]
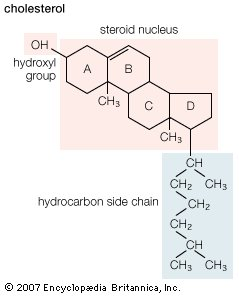
Image: The structure of Cholesterol.
Source: Britannica.[12]
They are a family of biological signaling molecules that act as short-range messengers. They originated from 20 carbon arachidonic acids, and include prostanoids and leukotrienes.[4]
These molecules are formed from two molecular pathways which include cyclooxygenase (cyclic pathway) and lipoxygenase (linear) pathways.[4] The cyclooxygenase pathway is followed by prostanoids which include prostaglandins, prostacyclins, and thrombooxygenase. The lipoxygenase pathway produces leukotrienes.[4]
Image: The structural representation of eicosanoids (prostaglandin, thromboxane, and leukotrienes).
Source: MSR blog.[13]
Lipids are divided into two categories based on the type of fatty acids present in them: saturated and unsaturated fatty acids.
Saturated fatty acids have no double or triple bonds. They are a simple, unbranched, and linear chain of CH2 groups connected with a carbon-carbon single bond and one carboxylic acid at its end. Their general formula is CH3 – (CH2)n – COOH., where n represents the number of methylene groups.[4]
Some examples of saturated fatty acids include lauric, myristic, palmitic, stearic, behenic, and lignoceric acids.[14]
Unsaturated fatty acids have one or more double or triple bonds. So, they can either be monounsaturated or polyunsaturated. The naturally occurring fatty acids are generally in the cis configuration, rather than in trans configuration.[4] There are only a few naturally occurring fatty acids with triple bonds and they’re often of plant origin, for example stearolic acid.[15]
The unsaturated fatty acids are named referring to the number of carbons they contain with the suffix -anoic (for saturated fatty acids) and -enoic (for unsaturated fatty acids). For example, stearic acid contains 18 carbons and is named octadecanoic acid (18:0). Here, 18:0 refers to 18 carbon fatty acids with zero double bonds.[4]
The other way of naming these molecules is by using the delta numeric system. For, example, cis-Δ9 represents the cis double bond between carbons 9 and 10. Similarly, trans-Δ4 represents trans double bonds between carbons 4 and 5.[4]
Some examples of monounsaturated fatty acids are palmitoleic acid, oleic acid, gadoleic acid, erucic acid, nervonic acid. And, some common polyunsaturated fatty acids include linoleic acid, linolenic acid, and arachidonic acid.[14]
Lipids on the basis of requirements are divided into two groups: essential and non-essential fatty acids.[16]
Fatty acids that cannot be produced or synthesized in our bodies are called essential fatty acids. These fatty acids need to be taken through a diet to fulfill the body’s requirement for different metabolic functions. It includes linoleic acid, linolenic acid, and arachidonic acid.[16]
Non-essential fatty acids include those lipids that are synthesized by our body. They are not needed to be taken through any outside food source. It includes palmitic acid, oleic acid, and butyric acid.[16]
Lipids being one of the major biomolecules in organisms play several roles. Here’s a list of key metabolic functions of lipids in organisms.[3]
Lipids of different classes function as signaling molecules or cellular messengers. They activate different signaling pathways either by binding with G-coupled receptors or nuclear receptors.[3] Some of the lipid molecules involved in signaling functions include:[3]
Triacylglycerols or triglycerides, residing in adipose tissues, are a major source of energy in both plants and animals. The complete breakdown of fatty acids releases about 38 kJ/g (9 kcal/g) caloric content.[3] The breakdown of triglycerides in the body is controlled by the enzyme lipase.
The plasma membrane of cells is made of a lipid bilayer with proteins embedded in it. The lipid bilayer is composed of amphipathic glycerophospholipid molecules.[3] All the glycolipids and phospholipids present in the cell membrane act as structural components of the membrane.
The cellular membrane also contains some non-glyceride lipids, which include sphingomyelin and sterols that are involved in membrane flexibility.[3]
Lipids are one of the major biomolecules playing key functions in different organisms. From their first appearance in 1665, the research on these molecules has come a long way. Now, it’s a big family containing different types of lipids including phosphoglycerides, glycolipids, lipoproteins, steroids, sphingomyelins, and eicosanoids.
These molecules regulate diverse bodily functions essential for the living of organisms. Further, current researches are focused on using these lipids in treating and diagnosing life-threatening diseases. For example, several scientists are working on delivering nanoparticles using lipoproteins as drug-delivery systems.[17]
Understanding the role of lipids in diseases can be fruitful in creating effective, targeted, and sustainable solutions in the healthcare sector.
In behavioral neuroscience, the Open Field Test (OFT) remains one of the most widely used assays to evaluate rodent models of affect, cognition, and motivation. It provides a non-invasive framework for examining how animals respond to novelty, stress, and pharmacological or environmental manipulations. Among the test’s core metrics, the percentage of time spent in the center zone offers a uniquely normalized and sensitive measure of an animal’s emotional reactivity and willingness to engage with a potentially risky environment.
This metric is calculated as the proportion of time spent in the central area of the arena—typically the inner 25%—relative to the entire session duration. By normalizing this value, researchers gain a behaviorally informative variable that is resilient to fluctuations in session length or overall movement levels. This makes it especially valuable in comparative analyses, longitudinal monitoring, and cross-model validation.
Unlike raw center duration, which can be affected by trial design inconsistencies, the percentage-based measure enables clearer comparisons across animals, treatments, and conditions. It plays a key role in identifying trait anxiety, avoidance behavior, risk-taking tendencies, and environmental adaptation, making it indispensable in both basic and translational research contexts.
Whereas simple center duration provides absolute time, the percentage-based metric introduces greater interpretability and reproducibility, especially when comparing different animal models, treatment conditions, or experimental setups. It is particularly effective for quantifying avoidance behaviors, risk assessment strategies, and trait anxiety profiles in both acute and longitudinal designs.
This metric reflects the relative amount of time an animal chooses to spend in the open, exposed portion of the arena—typically defined as the inner 25% of a square or circular enclosure. Because rodents innately prefer the periphery (thigmotaxis), time in the center is inversely associated with anxiety-like behavior. As such, this percentage is considered a sensitive, normalized index of:
Critically, because this metric is normalized by session duration, it accommodates variability in activity levels or testing conditions. This makes it especially suitable for comparing across individuals, treatment groups, or timepoints in longitudinal studies.
A high percentage of center time indicates reduced anxiety, increased novelty-seeking, or pharmacological modulation (e.g., anxiolysis). Conversely, a low percentage suggests emotional inhibition, behavioral avoidance, or contextual hypervigilance. reduced anxiety, increased novelty-seeking, or pharmacological modulation (e.g., anxiolysis). Conversely, a low percentage suggests emotional inhibition, behavioral avoidance, or contextual hypervigilance.
The percentage of center time is one of the most direct, unconditioned readouts of anxiety-like behavior in rodents. It is frequently reduced in models of PTSD, chronic stress, or early-life adversity, where animals exhibit persistent avoidance of the center due to heightened emotional reactivity. This metric can also distinguish between acute anxiety responses and enduring trait anxiety, especially in longitudinal or developmental studies. Its normalized nature makes it ideal for comparing across cohorts with variable locomotor profiles, helping researchers detect true affective changes rather than activity-based confounds.
Rodents that spend more time in the center zone typically exhibit broader and more flexible exploration strategies. This behavior reflects not only reduced anxiety but also cognitive engagement and environmental curiosity. High center percentage is associated with robust spatial learning, attentional scanning, and memory encoding functions, supported by coordinated activation in the prefrontal cortex, hippocampus, and basal forebrain. In contrast, reduced center engagement may signal spatial rigidity, attentional narrowing, or cognitive withdrawal, particularly in models of neurodegeneration or aging.
The open field test remains one of the most widely accepted platforms for testing anxiolytic and psychotropic drugs. The percentage of center time reliably increases following administration of anxiolytic agents such as benzodiazepines, SSRIs, and GABA-A receptor agonists. This metric serves as a sensitive and reproducible endpoint in preclinical dose-finding studies, mechanistic pharmacology, and compound screening pipelines. It also aids in differentiating true anxiolytic effects from sedation or motor suppression by integrating with other behavioral parameters like distance traveled and entry count (Prut & Belzung, 2003).
Sex-based differences in emotional regulation often manifest in open field behavior, with female rodents generally exhibiting higher variability in center zone metrics due to hormonal cycling. For example, estrogen has been shown to facilitate exploratory behavior and increase center occupancy, while progesterone and stress-induced corticosterone often reduce it. Studies involving gonadectomy, hormone replacement, or sex-specific genetic knockouts use this metric to quantify the impact of endocrine factors on anxiety and exploratory behavior. As such, it remains a vital tool for dissecting sex-dependent neurobehavioral dynamics.
The percentage of center time is one of the most direct, unconditioned readouts of anxiety-like behavior in rodents. It is frequently reduced in models of PTSD, chronic stress, or early-life adversity. Because it is normalized, this metric is especially helpful for distinguishing between genuine avoidance and low general activity.
Environmental Control: Uniformity in environmental conditions is essential. Lighting should be evenly diffused to avoid shadow bias, and noise should be minimized to prevent stress-induced variability. The arena must be cleaned between trials using odor-neutral solutions to eliminate scent trails or pheromone cues that may affect zone preference. Any variation in these conditions can introduce systematic bias in center zone behavior. Use consistent definitions of the center zone (commonly 25% of total area) to allow valid comparisons. Software-based segmentation enhances spatial precision.
Evaluating how center time evolves across the duration of a session—divided into early, middle, and late thirds—provides insight into behavioral transitions and adaptive responses. Animals may begin by avoiding the center, only to gradually increase center time as they habituate to the environment. Conversely, persistently low center time across the session can signal prolonged anxiety, fear generalization, or a trait-like avoidance phenotype.
To validate the significance of center time percentage, it should be examined alongside results from other anxiety-related tests such as the Elevated Plus Maze, Light-Dark Box, or Novelty Suppressed Feeding. Concordance across paradigms supports the reliability of center time as a trait marker, while discordance may indicate task-specific reactivity or behavioral dissociation.
When paired with high-resolution scoring of behavioral events such as rearing, grooming, defecation, or immobility, center time offers a richer view of the animal’s internal state. For example, an animal that spends substantial time in the center while grooming may be coping with mild stress, while another that remains immobile in the periphery may be experiencing more severe anxiety. Microstructure analysis aids in decoding the complexity behind spatial behavior.
Animals naturally vary in their exploratory style. By analyzing percentage of center time across subjects, researchers can identify behavioral subgroups—such as consistently bold individuals who frequently explore the center versus cautious animals that remain along the periphery. These classifications can be used to examine predictors of drug response, resilience to stress, or vulnerability to neuropsychiatric disorders.
In studies with large cohorts or multiple behavioral variables, machine learning techniques such as hierarchical clustering or principal component analysis can incorporate center time percentage to discover novel phenotypic groupings. These data-driven approaches help uncover latent dimensions of behavior that may not be visible through univariate analyses alone.
Total locomotion helps contextualize center time. Low percentage values in animals with minimal movement may reflect sedation or fatigue, while similar values in high-mobility subjects suggest deliberate avoidance. This metric helps distinguish emotional versus motor causes of low center engagement.
This measure indicates how often the animal initiates exploration of the center zone. When combined with percentage of time, it differentiates between frequent but brief visits (indicative of anxiety or impulsivity) versus fewer but sustained center engagements (suggesting comfort and behavioral confidence).
The delay before the first center entry reflects initial threat appraisal. Longer latencies may be associated with heightened fear or low motivation, while shorter latencies are typically linked to exploratory drive or low anxiety.
Time spent hugging the walls offers a spatial counterbalance to center metrics. High thigmotaxis and low center time jointly support an interpretation of strong avoidance behavior. This inverse relationship helps triangulate affective and motivational states.
By expressing center zone activity as a proportion of total trial time, researchers gain a metric that is resistant to session variability and more readily comparable across time, treatment, and model conditions. This normalized measure enhances reproducibility and statistical power, particularly in multi-cohort or cross-laboratory designs.
For experimental designs aimed at assessing anxiety, exploratory strategy, or affective state, the percentage of time spent in the center offers one of the most robust and interpretable measures available in the Open Field Test.
Written by researchers, for researchers — powered by Conduct Science.


Monday – Friday
9 AM – 5 PM EST
DISCLAIMER: ConductScience and affiliate products are NOT designed for human consumption, testing, or clinical utilization. They are designed for pre-clinical utilization only. Customers purchasing apparatus for the purposes of scientific research or veterinary care affirm adherence to applicable regulatory bodies for the country in which their research or care is conducted.