

Do you wonder how molecules are transported inside cells?
The transport of molecules across the cell membrane or in the cell follows two pathways: passive transport and active transport. Active transport is the transport of molecules against a concentration gradient across the cell membrane using transport proteins and energy. In contrast, passive transport is a direct transfer of molecules across the membrane down the concentration gradient.
The transport rate of molecules down the concentration gradient depends on the permeability and fluidity of the cell membrane. These two properties, membrane permeability, and fluidity further depend on the physiological and structural characteristics of the cell membrane.
This article covers cell membrane permeability, methods to measure the rate of permeation of molecules, and the factors that affect the permeability of the cell. You will also get a glimpse of membrane fluidity and the factors that influence this property.
Permeability of a membrane is the rate of passive diffusion of molecules across the membrane. It’s the ease with which molecules pass through the membrane barrier.[1]
The cell membrane is selectively permeable and only allows specific molecules to enter the cell.[1] This function is essential for the normal functioning of organisms.
Fluidity is defined as the ability or ease of molecules to move in the membrane. It refers to the viscosity of the cell membrane and affects the diffusion of proteins and other molecules inside cells, thus, affecting their function.[2] This property is affected by phospholipid structure, cholesterol composition in the membrane, and temperature.[2]
The selective permeability and cell fluidity of the membrane are due to its structural composition. The cell membrane, also known as the plasma membrane or biological membrane, separates the interior from the outer surroundings.
It acts as a structural control barrier in transporting molecules inside the cells for metabolic regulations or other functions of the body. The membrane consists of lipids, protein, carbohydrates, and cholesterol.
The three classes of lipids that compose the membrane’s structure are phospholipids, glycolipids, and sterols. A phospholipid is composed of alcohol (glycerol and sphingosine), fatty acids, phosphate, and alcohol, attached to phosphates.
The two main classes of phospholipids include glycerophospholipids and sphingophospholipids. Other than these two, glycolipids and sterols also have significant contributions to building the membrane structure.
Glycolipids are carbohydrates covalently attached to lipids, while sterols are multi-hydroxy alcohols with multiple ring structures. The principal sterol present in the biological membrane is cholesterol.
It’s an integral part of the cell membrane. The two types of proteins involved in the structural formation of membranes are intrinsic membrane protein and extrinsic membrane protein.
Intrinsic membrane proteins are either completely or partially embedded in the lipid bilayer of the membrane. In contrast, extrinsic membrane proteins are loosely bound proteins attached to the surface of the membrane.
They are present on the surface of the membrane. They are either glycoproteins (carbohydrates attached to proteins) or glycolipids (carbohydrates attached to lipids).
Carbohydrates on the surface of plasma membranes consist of 2 to 60 monosaccharide units that can be straight or branched. They coat the cell surface and protect it from any damage or harm and mediate cell-cell adhesion events.
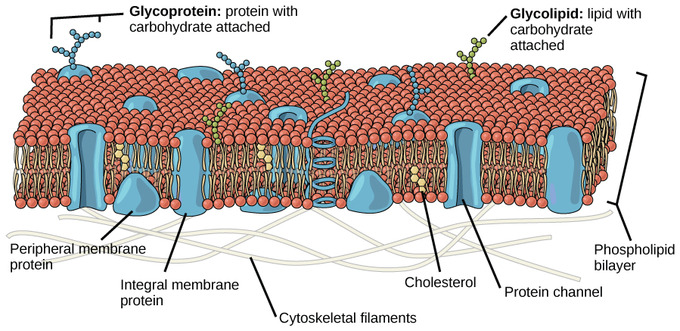
Figure: An illustrative diagram of cell membrane showing its different structural elements.[3]
The two main players in the cell membrane that affects its permeability are:
The saturated fatty acid tightly packs the protein bilayer, making it difficult for the molecules to pass across the membrane. And, the bulky hydrophilic parts of the hydrophilic groups of phospholipids trap the polar and charged molecules, restricting their movement through passive diffusion.
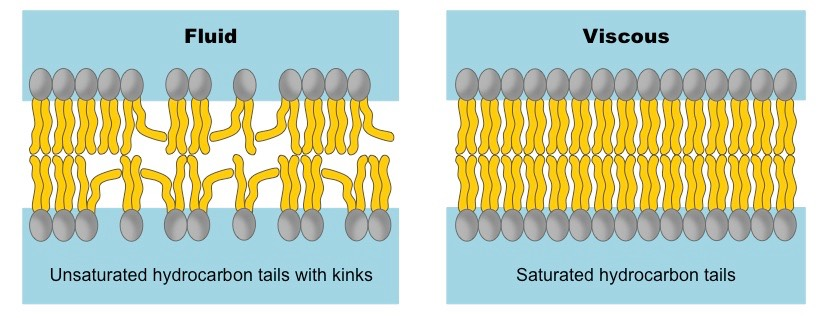
Figure: An illustration of the effect of saturated and unsaturated carbons on membrane fluidity.[5]
An increase in the temperature increases membrane permeability. At a freezing 0 degrees temperature, the phospholipids in the membrane are tightly packed and become rigid, and this decreases the permeability.[6] However, increasing the temperature up to 45 degrees celsius increases the permeability because of the loosening of the phospholipid structures in the membrane.[6]
The normal pH of the cell is 7. Increasing or decreasing the pH of a cell surrounding by 1 unit, that is, to 6 and 8, disrupts the structural forms of the membrane, reduces the permeability of the membrane, and disrupts its function.[3]
Smaller molecules without any charges, such as CO2, N2, O2, and molecules with high solubility in fat such as ethanol, have the fastest rate of diffusion.[7] These molecules can easily move across the membrane through passive diffusion without any membrane protein or energy.
The permeability decreases for molecules having charges or those bigger in size.[7] These structural features of molecules don’t have any effect on membrane fluidity.
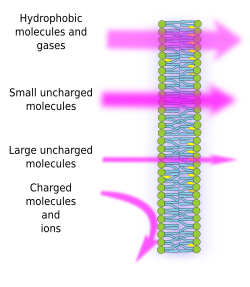
Figure: A representation of permeability of molecules across the membrane, based on their size and charges.[7]
The permeability of the cell membrane plays an essential role in the transport of molecules. Scientists are working to alter the membrane’s permeability for its application in enhancing and smoothing the process of drug delivery in cells at the target location.
That’s why scientists have designed certain approaches to enhance membrane permeation and achieve drug delivery, some of which are explained below:[8]
Membrane permeation is an essential factor considered while designing principles that maximize obtaining a drug and its distribution in the organisms. Better permeability increases the bioavailability (concentration of a chemical that is available for biological action) of the drug molecule.[8]
In such efforts, conjugating compounds to known transporter substrates are designed to have improved permeation, releasing the drug molecule in the membrane.[8]
Peptides can not cross the membrane passively, and that’s why scientists are trying to alter their physical properties like conformational flexibility and polarity to improve their permeability across the membrane.[8]
For example, scientists proposed that cyclizing a given peptide and methylating nitrogen involved in the amide bond can improve the permeation of the peptide.[8]
Furthermore, in some cases, cyclization by changing the peptide’s α-helical content and the presence of arginine residue within α-helices is also found to have increased permeability.[8]
The size and polarity of protein molecules make it difficult for them to cross the membrane passively.[8] Due to the vast differences between different proteins’ physicochemical properties, there’s no generalized technique to enhance their permeability. Given below are some approaches introduced by scientists to ease the delivery of proteins across the membrane:[8]
Cell permeability and cell fluidity are two essential properties, having roles in transporting molecules across the membrane. These properties are affected by physiological factors like temperature, pH, and the membrane’s composition. Any extremity of these factors disrupts the membrane molecules that build the membrane, thus, affecting the normal functioning of the organism.
The permeability of molecules is a trending research topic among scientists because of its role in drug delivery. They are working to alter the properties of the membrane or create certain approaches that can enhance drug delivery in cells and treat certain diseases.
Some of the methods that have been or are being tested include mechanical disruption of the membrane, virus-based strategies, protein-based strategies, and lipid and polymer-based strategies.
These approaches are still not frequent in practice and need serious consideration and in-depth analysis before bringing them in for actual medical practices. But they do show promising potential in the medical field.
In behavioral neuroscience, the Open Field Test (OFT) remains one of the most widely used assays to evaluate rodent models of affect, cognition, and motivation. It provides a non-invasive framework for examining how animals respond to novelty, stress, and pharmacological or environmental manipulations. Among the test’s core metrics, the percentage of time spent in the center zone offers a uniquely normalized and sensitive measure of an animal’s emotional reactivity and willingness to engage with a potentially risky environment.
This metric is calculated as the proportion of time spent in the central area of the arena—typically the inner 25%—relative to the entire session duration. By normalizing this value, researchers gain a behaviorally informative variable that is resilient to fluctuations in session length or overall movement levels. This makes it especially valuable in comparative analyses, longitudinal monitoring, and cross-model validation.
Unlike raw center duration, which can be affected by trial design inconsistencies, the percentage-based measure enables clearer comparisons across animals, treatments, and conditions. It plays a key role in identifying trait anxiety, avoidance behavior, risk-taking tendencies, and environmental adaptation, making it indispensable in both basic and translational research contexts.
Whereas simple center duration provides absolute time, the percentage-based metric introduces greater interpretability and reproducibility, especially when comparing different animal models, treatment conditions, or experimental setups. It is particularly effective for quantifying avoidance behaviors, risk assessment strategies, and trait anxiety profiles in both acute and longitudinal designs.
This metric reflects the relative amount of time an animal chooses to spend in the open, exposed portion of the arena—typically defined as the inner 25% of a square or circular enclosure. Because rodents innately prefer the periphery (thigmotaxis), time in the center is inversely associated with anxiety-like behavior. As such, this percentage is considered a sensitive, normalized index of:
Critically, because this metric is normalized by session duration, it accommodates variability in activity levels or testing conditions. This makes it especially suitable for comparing across individuals, treatment groups, or timepoints in longitudinal studies.
A high percentage of center time indicates reduced anxiety, increased novelty-seeking, or pharmacological modulation (e.g., anxiolysis). Conversely, a low percentage suggests emotional inhibition, behavioral avoidance, or contextual hypervigilance. reduced anxiety, increased novelty-seeking, or pharmacological modulation (e.g., anxiolysis). Conversely, a low percentage suggests emotional inhibition, behavioral avoidance, or contextual hypervigilance.
The percentage of center time is one of the most direct, unconditioned readouts of anxiety-like behavior in rodents. It is frequently reduced in models of PTSD, chronic stress, or early-life adversity, where animals exhibit persistent avoidance of the center due to heightened emotional reactivity. This metric can also distinguish between acute anxiety responses and enduring trait anxiety, especially in longitudinal or developmental studies. Its normalized nature makes it ideal for comparing across cohorts with variable locomotor profiles, helping researchers detect true affective changes rather than activity-based confounds.
Rodents that spend more time in the center zone typically exhibit broader and more flexible exploration strategies. This behavior reflects not only reduced anxiety but also cognitive engagement and environmental curiosity. High center percentage is associated with robust spatial learning, attentional scanning, and memory encoding functions, supported by coordinated activation in the prefrontal cortex, hippocampus, and basal forebrain. In contrast, reduced center engagement may signal spatial rigidity, attentional narrowing, or cognitive withdrawal, particularly in models of neurodegeneration or aging.
The open field test remains one of the most widely accepted platforms for testing anxiolytic and psychotropic drugs. The percentage of center time reliably increases following administration of anxiolytic agents such as benzodiazepines, SSRIs, and GABA-A receptor agonists. This metric serves as a sensitive and reproducible endpoint in preclinical dose-finding studies, mechanistic pharmacology, and compound screening pipelines. It also aids in differentiating true anxiolytic effects from sedation or motor suppression by integrating with other behavioral parameters like distance traveled and entry count (Prut & Belzung, 2003).
Sex-based differences in emotional regulation often manifest in open field behavior, with female rodents generally exhibiting higher variability in center zone metrics due to hormonal cycling. For example, estrogen has been shown to facilitate exploratory behavior and increase center occupancy, while progesterone and stress-induced corticosterone often reduce it. Studies involving gonadectomy, hormone replacement, or sex-specific genetic knockouts use this metric to quantify the impact of endocrine factors on anxiety and exploratory behavior. As such, it remains a vital tool for dissecting sex-dependent neurobehavioral dynamics.
The percentage of center time is one of the most direct, unconditioned readouts of anxiety-like behavior in rodents. It is frequently reduced in models of PTSD, chronic stress, or early-life adversity. Because it is normalized, this metric is especially helpful for distinguishing between genuine avoidance and low general activity.
Environmental Control: Uniformity in environmental conditions is essential. Lighting should be evenly diffused to avoid shadow bias, and noise should be minimized to prevent stress-induced variability. The arena must be cleaned between trials using odor-neutral solutions to eliminate scent trails or pheromone cues that may affect zone preference. Any variation in these conditions can introduce systematic bias in center zone behavior. Use consistent definitions of the center zone (commonly 25% of total area) to allow valid comparisons. Software-based segmentation enhances spatial precision.
Evaluating how center time evolves across the duration of a session—divided into early, middle, and late thirds—provides insight into behavioral transitions and adaptive responses. Animals may begin by avoiding the center, only to gradually increase center time as they habituate to the environment. Conversely, persistently low center time across the session can signal prolonged anxiety, fear generalization, or a trait-like avoidance phenotype.
To validate the significance of center time percentage, it should be examined alongside results from other anxiety-related tests such as the Elevated Plus Maze, Light-Dark Box, or Novelty Suppressed Feeding. Concordance across paradigms supports the reliability of center time as a trait marker, while discordance may indicate task-specific reactivity or behavioral dissociation.
When paired with high-resolution scoring of behavioral events such as rearing, grooming, defecation, or immobility, center time offers a richer view of the animal’s internal state. For example, an animal that spends substantial time in the center while grooming may be coping with mild stress, while another that remains immobile in the periphery may be experiencing more severe anxiety. Microstructure analysis aids in decoding the complexity behind spatial behavior.
Animals naturally vary in their exploratory style. By analyzing percentage of center time across subjects, researchers can identify behavioral subgroups—such as consistently bold individuals who frequently explore the center versus cautious animals that remain along the periphery. These classifications can be used to examine predictors of drug response, resilience to stress, or vulnerability to neuropsychiatric disorders.
In studies with large cohorts or multiple behavioral variables, machine learning techniques such as hierarchical clustering or principal component analysis can incorporate center time percentage to discover novel phenotypic groupings. These data-driven approaches help uncover latent dimensions of behavior that may not be visible through univariate analyses alone.
Total locomotion helps contextualize center time. Low percentage values in animals with minimal movement may reflect sedation or fatigue, while similar values in high-mobility subjects suggest deliberate avoidance. This metric helps distinguish emotional versus motor causes of low center engagement.
This measure indicates how often the animal initiates exploration of the center zone. When combined with percentage of time, it differentiates between frequent but brief visits (indicative of anxiety or impulsivity) versus fewer but sustained center engagements (suggesting comfort and behavioral confidence).
The delay before the first center entry reflects initial threat appraisal. Longer latencies may be associated with heightened fear or low motivation, while shorter latencies are typically linked to exploratory drive or low anxiety.
Time spent hugging the walls offers a spatial counterbalance to center metrics. High thigmotaxis and low center time jointly support an interpretation of strong avoidance behavior. This inverse relationship helps triangulate affective and motivational states.
By expressing center zone activity as a proportion of total trial time, researchers gain a metric that is resistant to session variability and more readily comparable across time, treatment, and model conditions. This normalized measure enhances reproducibility and statistical power, particularly in multi-cohort or cross-laboratory designs.
For experimental designs aimed at assessing anxiety, exploratory strategy, or affective state, the percentage of time spent in the center offers one of the most robust and interpretable measures available in the Open Field Test.
Written by researchers, for researchers — powered by Conduct Science.


Monday – Friday
9 AM – 5 PM EST
DISCLAIMER: ConductScience and affiliate products are NOT designed for human consumption, testing, or clinical utilization. They are designed for pre-clinical utilization only. Customers purchasing apparatus for the purposes of scientific research or veterinary care affirm adherence to applicable regulatory bodies for the country in which their research or care is conducted.