


Reference to this article: ConductScience, Ultimate Guide to Automated Cell Counter: Plus Purchasing Tips (2022). doi.org/10.55157/CS20220614
Cell counting is routinely performed in life science research labs and medical diagnosis and treatment. There are many ways to count cells in labs, which do not require special equipment.
However, the use of equipment and instruments increases the accuracy of the obtained data. Additionally, they make the process faster and easier, even when working with more samples or needing to analyze large sample volumes.
The two categories of cell counting are manual counting and automated counting. The manual counting is done using a counting chamber or hemocytometer and plating or colony-forming unit (CFU) counting method.[1] In contrast, automated cell counting involves automated, high-throughput, specialized machines that automatically count the cells.
This article discusses the different automated cell counters, their principle and types, and how to choose the right automated cell counter for your lab.
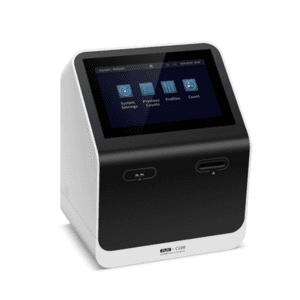
Figure: An image of an automated cell counter machine.
An automated cell counter is a machine that either works on the principle of image analysis or electrical impedance to count cells automatically.[2]
These cell counters are based on two basic principles: electrical impedance and the light scattering principle.[3]
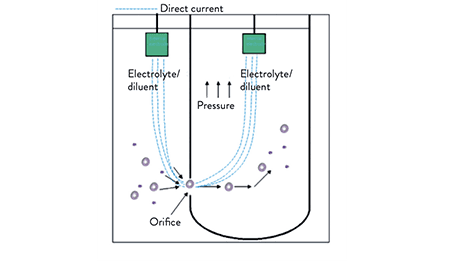
Figure: An illustration of the electrical impedance principle of cell counting.[3]
The electrical impedance is also known as the Coulter principle.[3] Here, an increase in electrical resistance or impedance is observed each time a cell passes through an aperture similar to the size of cells present between two electrodes.
This change in impedance is directly proportional to the cell volume, which helps to count the number of cells in the sample’s given volume.[3]
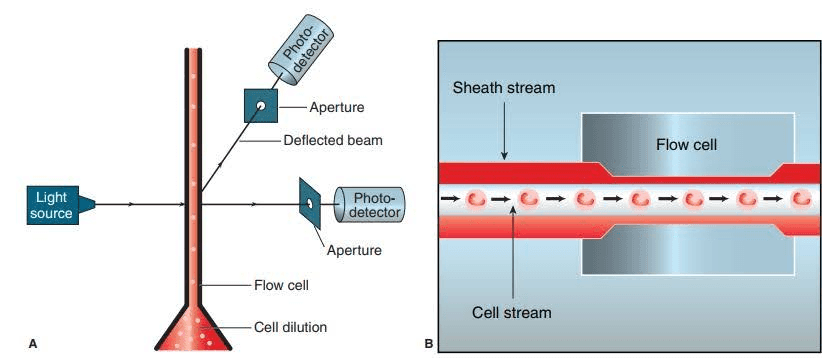
Figure: An illustrative diagram of the light-scattering cell counting experiment.[4]
The principle is based on the observation that cells, like blood cells, scatter into small angles when visible light is incident on them.[4]
Here, when a light beam is passed across a stream of diluted cells, it is deflected due to the cell, and the deflection is detected by the photodetector, which gives the number of cells present in the sample’s given volume.[4]
Based on different working principles, there are mainly four types of automated cell counter methods for different lab applications.[1]
In addition to determining the cell count, the device is also used to measure the cell volume in electrolytes. It is cheaper than a flow cytometer and has applications in particle characterization, hematology, and counting various cells, such as fat cells, plant cell aggregates, bacteria, and stem cell embryoid bodies.[5]
This method involves using a microscope and statistical classification algorithm to carry out automated cell detection and then counting cells by image analysis.[1]
Here, cells move in a narrow stream in the front of the laser beam, which, when hit, reflects the cells on a detector that keeps the cell count. This method is also used to analyze cell shape, their internal and external structures, and determine the number of proteins and certain biochemicals.[1]
Flow cytometry is the most expensive technique among automated cell counter techniques.
In this method, cells are counted in histological sections. It utilizes a systematic and random sampling strategy to determine the frequency of objects or count the cell numbers.[1]
However, the technique is not fully automated as it involves manual decisions in sampling or including cells for the counting procedure and analysis.
Automated cell counter machines work differently. So, it’s highly recommended to go through the user manual that comes with the commercial instruments to learn about their workings and procedures they can perform.
Below is the workflow for the most commonly used commercial automated cell counters:
The sample for cell counting can either be prepared without or with trypan blue staining.[7]
If you observe “value out of range” on your screen, view the image captured and provided by the machine and determine if you need to dilute the cell suspension.[7] Once done, remove the counting slides from the slot and dispose of them as biohazardous waste.
You’ve learned how a spectrum of automated cell counters is commercially available, working on different principles. So, how can you decide which one fits your needs? We’ve made this easy for you by compiling a list of factors that you can follow before acquiring an automated cell counter.
The size of the cell counting area and variation in the data due to multiple counters influence the accuracy of the counted cells. And it’s believed that a larger area of counted cells and more sophisticated algorithms work best as they enable the correction in the hardware inequality and reduce the data variability.[8]
The automated cell counters are available with different features, including a user-friendly interface and button operator interface.[9] So, pick a system that is easy for you to operate, has features suiting your requirements, and produces consistent and accurate results within a short time.
When working on high-throughput research, you want your data to be reproducible. Look for an automated cell counter with a defined measuring area for the cell counts. This way, you will get equal sizes of the captured images, reducing or eliminating variations in the field of view.[8]
A cell suspension often consists of both living and dead cells because it’s quite impossible to remove the debris and dead cells during sample preparation completely. But when counting cells, you don’t want to count the dead cells as living cells.
To help with this, the automated cell counters distinguish the live cells from dead ones by black edges and white centers.[8] So when purchasing an automated cell counter, make sure it has the autofocusing technology and high camera resolution.
Some cells remain as cluster cells during sample preparation, and during counting, the cell counters might count them as one cell. This can shake the accuracy and reliability of your result. So, look for those automated cell counters that come with integrated software to recognize clustered cells and count each cell in the cluster.[8]
The storage and memory of the cell counters is one essential factor in making your counting process a sliding ride. If you need to run a large number of samples routinely, then it’s preferable to purchase counters with better storage features.[8] Also, check the number of results it can store at a time.
It’s essential to purchase your automated cell counter from a known supplier. This will ensure you have a system with updated, first-hand software that works efficiently,[9], and they should also offer repair services.
Moreover, experienced suppliers can often help you choose the right equipment, fitting your needs and budget.
Automated cell counters are available in many forms, benchtop, hand-help, or bulky forms. So, if you have constrained space, look for counters that take less space but have all the features you need to facilitate your process.
What’s your assigned budget for the cell counter? Also, consider the prices of accessories or consumables of the equipment, such as disposable slides. Based on that, look for a supplier who can help you avail the equipment in your budget with effective maintenance services and service contracts.
Automated cell counters are instruments used in life sciences labs to count cells. It works on the principle of image analysis or electrical impedance to count the number of cells in the given sample.
The automated cell counters provide many benefits over manual ones, such as faster and more accurate results, less labor work, running multiple samples, and data storage. However, there’re also limitations to the machine, including the inability to differentiate dead cells from live cells and counting a cluster of cells as individual cells.
Different automated cell counters have different working principles and thus have different features and operational capabilities. Therefore, it’s necessary to consider machine features, storage, lab space, user interface, accurate focusing and cell counting, and budget when purchasing automated cell counters.
Our automated cell counter has got you covered if you need a faster and more efficient way to count cells from a reliable supplier at an affordable cost.
In behavioral neuroscience, the Open Field Test (OFT) remains one of the most widely used assays to evaluate rodent models of affect, cognition, and motivation. It provides a non-invasive framework for examining how animals respond to novelty, stress, and pharmacological or environmental manipulations. Among the test’s core metrics, the percentage of time spent in the center zone offers a uniquely normalized and sensitive measure of an animal’s emotional reactivity and willingness to engage with a potentially risky environment.
This metric is calculated as the proportion of time spent in the central area of the arena—typically the inner 25%—relative to the entire session duration. By normalizing this value, researchers gain a behaviorally informative variable that is resilient to fluctuations in session length or overall movement levels. This makes it especially valuable in comparative analyses, longitudinal monitoring, and cross-model validation.
Unlike raw center duration, which can be affected by trial design inconsistencies, the percentage-based measure enables clearer comparisons across animals, treatments, and conditions. It plays a key role in identifying trait anxiety, avoidance behavior, risk-taking tendencies, and environmental adaptation, making it indispensable in both basic and translational research contexts.
Whereas simple center duration provides absolute time, the percentage-based metric introduces greater interpretability and reproducibility, especially when comparing different animal models, treatment conditions, or experimental setups. It is particularly effective for quantifying avoidance behaviors, risk assessment strategies, and trait anxiety profiles in both acute and longitudinal designs.
This metric reflects the relative amount of time an animal chooses to spend in the open, exposed portion of the arena—typically defined as the inner 25% of a square or circular enclosure. Because rodents innately prefer the periphery (thigmotaxis), time in the center is inversely associated with anxiety-like behavior. As such, this percentage is considered a sensitive, normalized index of:
Critically, because this metric is normalized by session duration, it accommodates variability in activity levels or testing conditions. This makes it especially suitable for comparing across individuals, treatment groups, or timepoints in longitudinal studies.
A high percentage of center time indicates reduced anxiety, increased novelty-seeking, or pharmacological modulation (e.g., anxiolysis). Conversely, a low percentage suggests emotional inhibition, behavioral avoidance, or contextual hypervigilance. reduced anxiety, increased novelty-seeking, or pharmacological modulation (e.g., anxiolysis). Conversely, a low percentage suggests emotional inhibition, behavioral avoidance, or contextual hypervigilance.
The percentage of center time is one of the most direct, unconditioned readouts of anxiety-like behavior in rodents. It is frequently reduced in models of PTSD, chronic stress, or early-life adversity, where animals exhibit persistent avoidance of the center due to heightened emotional reactivity. This metric can also distinguish between acute anxiety responses and enduring trait anxiety, especially in longitudinal or developmental studies. Its normalized nature makes it ideal for comparing across cohorts with variable locomotor profiles, helping researchers detect true affective changes rather than activity-based confounds.
Rodents that spend more time in the center zone typically exhibit broader and more flexible exploration strategies. This behavior reflects not only reduced anxiety but also cognitive engagement and environmental curiosity. High center percentage is associated with robust spatial learning, attentional scanning, and memory encoding functions, supported by coordinated activation in the prefrontal cortex, hippocampus, and basal forebrain. In contrast, reduced center engagement may signal spatial rigidity, attentional narrowing, or cognitive withdrawal, particularly in models of neurodegeneration or aging.
The open field test remains one of the most widely accepted platforms for testing anxiolytic and psychotropic drugs. The percentage of center time reliably increases following administration of anxiolytic agents such as benzodiazepines, SSRIs, and GABA-A receptor agonists. This metric serves as a sensitive and reproducible endpoint in preclinical dose-finding studies, mechanistic pharmacology, and compound screening pipelines. It also aids in differentiating true anxiolytic effects from sedation or motor suppression by integrating with other behavioral parameters like distance traveled and entry count (Prut & Belzung, 2003).
Sex-based differences in emotional regulation often manifest in open field behavior, with female rodents generally exhibiting higher variability in center zone metrics due to hormonal cycling. For example, estrogen has been shown to facilitate exploratory behavior and increase center occupancy, while progesterone and stress-induced corticosterone often reduce it. Studies involving gonadectomy, hormone replacement, or sex-specific genetic knockouts use this metric to quantify the impact of endocrine factors on anxiety and exploratory behavior. As such, it remains a vital tool for dissecting sex-dependent neurobehavioral dynamics.
The percentage of center time is one of the most direct, unconditioned readouts of anxiety-like behavior in rodents. It is frequently reduced in models of PTSD, chronic stress, or early-life adversity. Because it is normalized, this metric is especially helpful for distinguishing between genuine avoidance and low general activity.
Environmental Control: Uniformity in environmental conditions is essential. Lighting should be evenly diffused to avoid shadow bias, and noise should be minimized to prevent stress-induced variability. The arena must be cleaned between trials using odor-neutral solutions to eliminate scent trails or pheromone cues that may affect zone preference. Any variation in these conditions can introduce systematic bias in center zone behavior. Use consistent definitions of the center zone (commonly 25% of total area) to allow valid comparisons. Software-based segmentation enhances spatial precision.
Evaluating how center time evolves across the duration of a session—divided into early, middle, and late thirds—provides insight into behavioral transitions and adaptive responses. Animals may begin by avoiding the center, only to gradually increase center time as they habituate to the environment. Conversely, persistently low center time across the session can signal prolonged anxiety, fear generalization, or a trait-like avoidance phenotype.
To validate the significance of center time percentage, it should be examined alongside results from other anxiety-related tests such as the Elevated Plus Maze, Light-Dark Box, or Novelty Suppressed Feeding. Concordance across paradigms supports the reliability of center time as a trait marker, while discordance may indicate task-specific reactivity or behavioral dissociation.
When paired with high-resolution scoring of behavioral events such as rearing, grooming, defecation, or immobility, center time offers a richer view of the animal’s internal state. For example, an animal that spends substantial time in the center while grooming may be coping with mild stress, while another that remains immobile in the periphery may be experiencing more severe anxiety. Microstructure analysis aids in decoding the complexity behind spatial behavior.
Animals naturally vary in their exploratory style. By analyzing percentage of center time across subjects, researchers can identify behavioral subgroups—such as consistently bold individuals who frequently explore the center versus cautious animals that remain along the periphery. These classifications can be used to examine predictors of drug response, resilience to stress, or vulnerability to neuropsychiatric disorders.
In studies with large cohorts or multiple behavioral variables, machine learning techniques such as hierarchical clustering or principal component analysis can incorporate center time percentage to discover novel phenotypic groupings. These data-driven approaches help uncover latent dimensions of behavior that may not be visible through univariate analyses alone.
Total locomotion helps contextualize center time. Low percentage values in animals with minimal movement may reflect sedation or fatigue, while similar values in high-mobility subjects suggest deliberate avoidance. This metric helps distinguish emotional versus motor causes of low center engagement.
This measure indicates how often the animal initiates exploration of the center zone. When combined with percentage of time, it differentiates between frequent but brief visits (indicative of anxiety or impulsivity) versus fewer but sustained center engagements (suggesting comfort and behavioral confidence).
The delay before the first center entry reflects initial threat appraisal. Longer latencies may be associated with heightened fear or low motivation, while shorter latencies are typically linked to exploratory drive or low anxiety.
Time spent hugging the walls offers a spatial counterbalance to center metrics. High thigmotaxis and low center time jointly support an interpretation of strong avoidance behavior. This inverse relationship helps triangulate affective and motivational states.
By expressing center zone activity as a proportion of total trial time, researchers gain a metric that is resistant to session variability and more readily comparable across time, treatment, and model conditions. This normalized measure enhances reproducibility and statistical power, particularly in multi-cohort or cross-laboratory designs.
For experimental designs aimed at assessing anxiety, exploratory strategy, or affective state, the percentage of time spent in the center offers one of the most robust and interpretable measures available in the Open Field Test.
Written by researchers, for researchers — powered by Conduct Science.


Monday – Friday
9 AM – 5 PM EST
DISCLAIMER: ConductScience and affiliate products are NOT designed for human consumption, testing, or clinical utilization. They are designed for pre-clinical utilization only. Customers purchasing apparatus for the purposes of scientific research or veterinary care affirm adherence to applicable regulatory bodies for the country in which their research or care is conducted.