


Chromosomes are thread-like structures, located in the nucleus, which carry hereditary information in the form of genes. Structurally, it is composed of ‘packaging proteins and DNA molecules’, and it is represented in different shapes and numbers which vary among different living organisms.
For example, bacteria have circular chromosomes, whereas organisms like humans and other animals have linear chromosomes (humans have linear chromosomes in the nucleus and circular chromosomes in mitochondria).
Similarly, the number of chromosomes also varies among different organisms:
| Name of organisms | Number of Chromosomes |
|---|---|
|
Human |
46 (23 pairs) |
|
Fruit fly |
8 (4 pairs) |
|
Monkey |
48 (24 pairs) |
|
Rat |
41 (21 pairs) |
Chromosomes are of two types: autosomes and sex chromosomes. This article is focused on the theory and facts of human sex chromosomes.
It includes every aspect of human sex chromosomes from the mechanism of sex determination and X-inactivation in humans to the sex chromosomes aneuploidy. It also provides a glimpse of how the mechanisms in humans differ from other organisms.
Ever wondered how you developed into a girl or a boy? Well, that is determined by the sex chromosomes of your parents.
Humans have a total of 23 pairs of chromosomes (two sets of chromosomes). One set of the chromosome is inherited from the mother and the other set from the father. Out of 23 pairs of chromosomes, 22 pairs are autosomes and 1 pair is sex chromosomes.
Autosomes function in the regulation of somatic characteristics of the individual (e.g. body weight, length of the body, etc.) whereas sex chromosomes are involved in the “sex determination” of the organisms and regulation of sex-linked traits.
In humans, sex is determined by two types of chromosomes, X and Y chromosomes. The X chromosome is three times larger than the Y chromosome. Moreover, it contains over 900 genes and the Y chromosome has only about 55 genes on it.
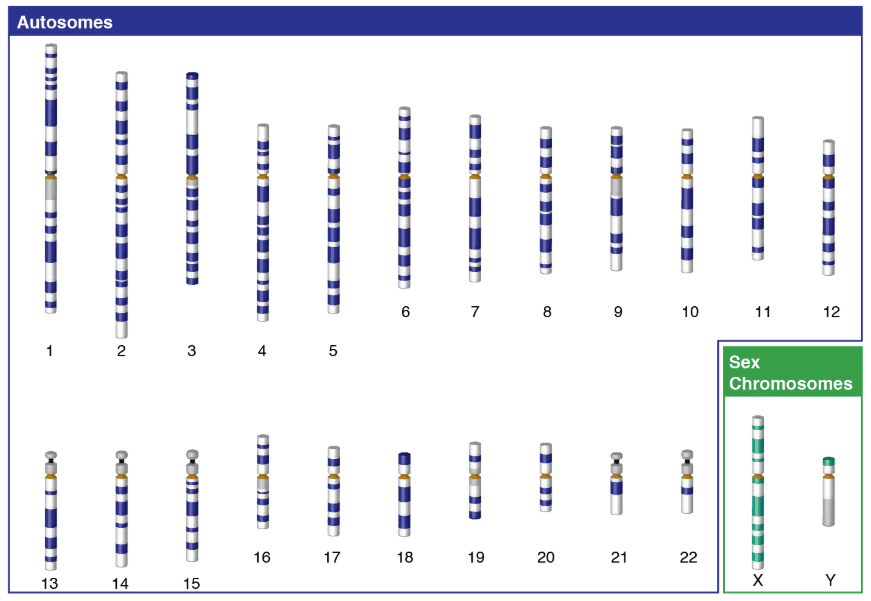
Figure: The illustration of the 23 pairs of chromosomes in humans (22 pairs autosomes and one pair sex chromosome)[6].
Source: https://www.genome.gov/genetics-glossary/Sex-Chromosome
Hermann Henking was the first to discover the X chromosome (in 1981). He named it the X element but he could not understand its role. In 1905, two scientists, Nettie Stevens and Edmund Beecher Wilson worked individually to study the role of sex chromosomes (on insects).
Stevens reported the presence of two large chromosomes in the beetle gonads (female), and one small and one large chromosome in the male sperm. She concluded that the small chromosomes carried by the sperm, determine the sex of the male[5].
Steven’s study was later supported by Wilson, that both large and small chromosomes are sex determinants and the small chromosome determines the maleness of an organism. He named the large chromosome “X” and the small one “Y”[5].
Later, scientists observed the absence of the small chromosome in wasps. It caused a dilemma, whether the presence or absence of the Y-chromosome is responsible for the maleness in organisms! Wilson resolved this by studying data from different labs. He concluded that two types of ‘sex determination systems’ exists among organisms.
Humans have an “XY system” of sex determination. The individual, having two X chromosomes (XX) develops into a female while the one with a pair of XY chromosomes will develop into a male.
In a few human cases, sex chromosome aneuploidy can also be observed. For example, an individual can be born with 47, XXY; 47, XYY; 47, XXX; and 45, X[4]– these kinds of chromosomal arrangements cause several abnormalities in the organisms.
But, an individual having a Y-chromosome (no matter how many X chromosomes are present) will always develop into a male. On the other hand, an individual without Y chromosomes will develop into a female.
Moreover, in females, one X chromosome is inherited from the mother and the other X from the father while in males X chromosome is always inherited from the mother[7].
Genes are the key regulators of all the features of the organisms so their role in sex determination cannot be neglected. However, in a few other organisms, there are some other factors, other than sex chromosomes, that decide the sex of the organisms. For example, in European turtles, sex is determined by the temperature of the surroundings.
The human embryo contains two types of duct, Mullerian duct, and Wolffian duct, in the seventh month of development. These ducts can develop a female or male reproductive tract. But, these ducts can not do it alone (by themselves). So how does it happen?
The SRY (Sex determining Region Y) gene, present on the short arm of the Y chromosome, encodes the Testes Determining Factor (TDF) which induces the formation of the testes.
The testis produces two types of hormone, anti-mullerian hormone (produced from Sertoli cells of the testis), and testosterone (from Leydig cells which are induced by Sertoli cells)[4].
The testosterone and its derivative dihydrotestosterone further induce the formation of organs of the male reproductive system whereas the anti-mullerian hormone (AMH) suppresses the development of the female reproductive tract.
When there is an absence of the Y chromosomes (in females), the SRY gene is not expressed and the pathway of ovary formation is activated. The ovary then secretes the female sex hormone, the estrogen, which activates the Mullerian duct that leads to the development of female reproductive organs (uterus, cervix, and oviducts)[4].
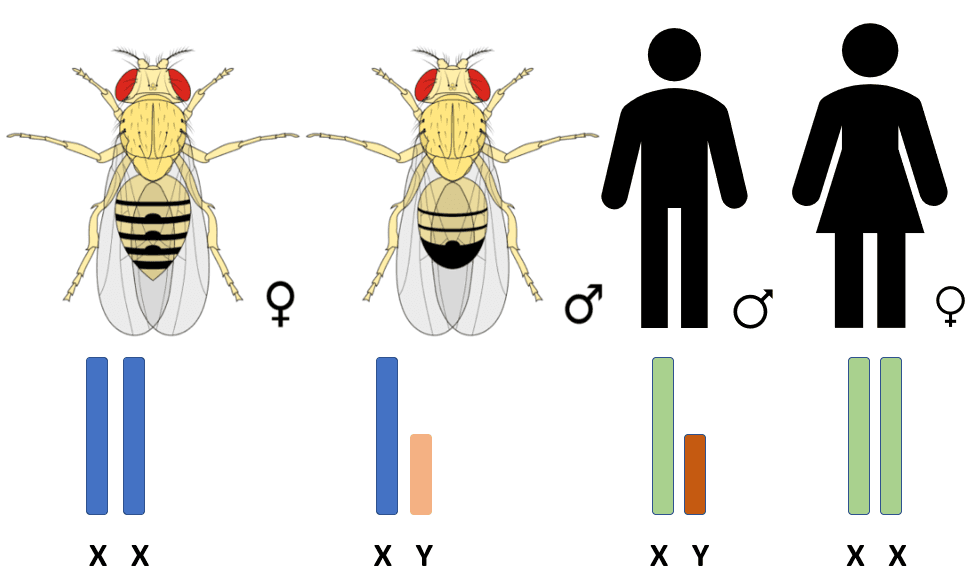
Figure: An illustration of a similar sex-determination system in humans and Drosophila melanogaster.
When the X:A ratio is ≥ 1.0 (1X:1A, 2X:2A, 3X:3A, and 3A:2A) then the fly will develop into a female[3]. On the other hand, when the ratio of X:A is ≤ 0.5, then a male will be developed.
An important fact about sex chromosomes is that the X chromosome is larger than the Y chromosome in size and contains 1000 genes more than the Y chromosome.
You know that a female has two X chromosomes and a male has only one. So, it is expected to see significant differences in gene expression, in both the sexes. But, the picture is quite the opposite! So, the question arises, “why is this difference not observed?”
The answer to the above question is “dosage compensation”.
When one sex of organism contains two dosages of one sex chromosome and the other sex has only one, then the difference in the expression level is achieved by a mechanism called dosage compensation. Variant mechanisms of dosage compensation, of X-linked genes, are evolved by different organisms.
In Humans (and other mammals as well), dosage compensation is achieved by the inactivation of the majority of genes, localized on one of the two X chromosomes in females, during early development. The inactivation of the X chromosome is a random process, either maternal or paternal X-chromosome (in female) is randomly inactivated.
The key gene that is involved in the process of the X-inactivation gene is the Xist (X-inactive-specific transcript) gene, present in the Xic region on the X chromosome[2]. The expression of Xist is asymmetrical in two X chromosomes.
The chromosomes having a higher expression of genes produce higher transcripts of Xist RNA[2]. The RNA, with some binding proteins, coats one of the two X chromosomes along its length and causes repression.
The inactivated X chromosome structurally becomes small, dense, and highly compact (condensed chromatin). This structure is called “Barr bodies”, named after its discoverer, Murray Barr. The feature of the presence and absence of Barr bodies is used in labs for the sex determination of the individual.
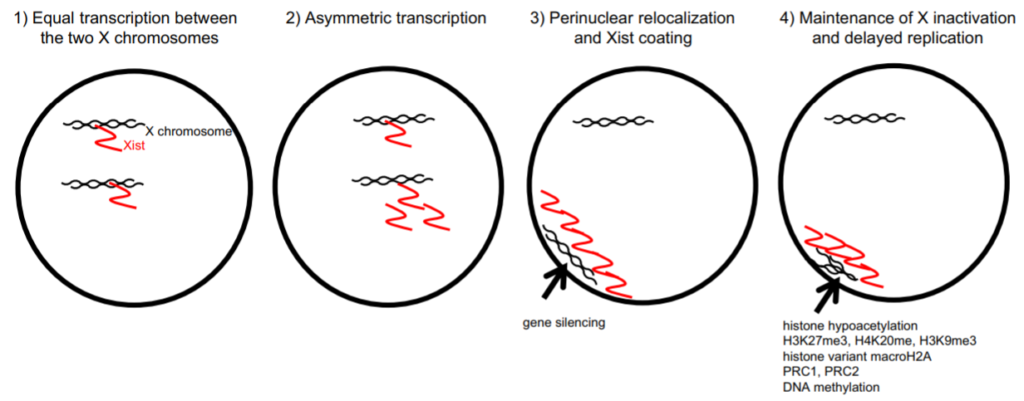
Figure: The random X chromosome inactivation in the mouse during embryogenesis[2].
Source: DOI:10.1016/bs.ircmb.2015.03.001.
Not all organisms follow a similar mechanism of dosage compensation. Researchers have found two other mechanisms of dosage compensation in other organisms which completely differ from humans!
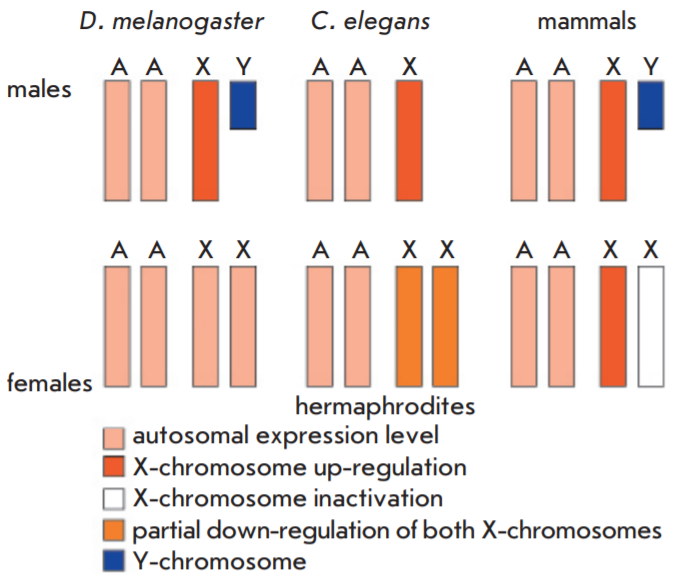
Figure: Illustration of difference in the mechanisms of dosage compensation in different organisms[1].
Aneuploidy is a condition of the presence of less than or more than the normal number of chromosomes. Sex chromosome aneuploidy is a condition in which the number of sex chromosomes alters in an organism.
For example, normally an organism has XX (in females) and XY (in males) sex chromosomes while during aneuploidy condition he/she can have XXX, XXY, XYY, XO, etc. type of chromosomal arrangements. The most common cause of sex chromosome aneuploidy is non-disjunction during the process of cell division (meiosis).
The aneuploidy condition leads to several abnormalities in the organism. A few examples of diseases[9] caused due to sex chromosome aneuploidy are given below:
Sex chromosomes are involved in the sex determination of organisms and the regulation of sex-linked traits. Various studies have also shown the involvement of other factors in the sex determination of other organisms.
However, humans have X and Y sex chromosomes, which are the only determining factors of the sex of a newborn human.
The presence and/or absence of the Y chromosome determine the maleness of the organism, while the inequality of the gene expression between males and females is balanced by the mechanism of X-inactivation.
If the normal number of sex chromosomes (XX or XY) is altered in an individual, it leads to several abnormalities in the affected human. Further research in this area will add more understanding to the sex linked genes, their inheritance, and the mechanism behind sex determination.
In behavioral neuroscience, the Open Field Test (OFT) remains one of the most widely used assays to evaluate rodent models of affect, cognition, and motivation. It provides a non-invasive framework for examining how animals respond to novelty, stress, and pharmacological or environmental manipulations. Among the test’s core metrics, the percentage of time spent in the center zone offers a uniquely normalized and sensitive measure of an animal’s emotional reactivity and willingness to engage with a potentially risky environment.
This metric is calculated as the proportion of time spent in the central area of the arena—typically the inner 25%—relative to the entire session duration. By normalizing this value, researchers gain a behaviorally informative variable that is resilient to fluctuations in session length or overall movement levels. This makes it especially valuable in comparative analyses, longitudinal monitoring, and cross-model validation.
Unlike raw center duration, which can be affected by trial design inconsistencies, the percentage-based measure enables clearer comparisons across animals, treatments, and conditions. It plays a key role in identifying trait anxiety, avoidance behavior, risk-taking tendencies, and environmental adaptation, making it indispensable in both basic and translational research contexts.
Whereas simple center duration provides absolute time, the percentage-based metric introduces greater interpretability and reproducibility, especially when comparing different animal models, treatment conditions, or experimental setups. It is particularly effective for quantifying avoidance behaviors, risk assessment strategies, and trait anxiety profiles in both acute and longitudinal designs.
This metric reflects the relative amount of time an animal chooses to spend in the open, exposed portion of the arena—typically defined as the inner 25% of a square or circular enclosure. Because rodents innately prefer the periphery (thigmotaxis), time in the center is inversely associated with anxiety-like behavior. As such, this percentage is considered a sensitive, normalized index of:
Critically, because this metric is normalized by session duration, it accommodates variability in activity levels or testing conditions. This makes it especially suitable for comparing across individuals, treatment groups, or timepoints in longitudinal studies.
A high percentage of center time indicates reduced anxiety, increased novelty-seeking, or pharmacological modulation (e.g., anxiolysis). Conversely, a low percentage suggests emotional inhibition, behavioral avoidance, or contextual hypervigilance. reduced anxiety, increased novelty-seeking, or pharmacological modulation (e.g., anxiolysis). Conversely, a low percentage suggests emotional inhibition, behavioral avoidance, or contextual hypervigilance.
The percentage of center time is one of the most direct, unconditioned readouts of anxiety-like behavior in rodents. It is frequently reduced in models of PTSD, chronic stress, or early-life adversity, where animals exhibit persistent avoidance of the center due to heightened emotional reactivity. This metric can also distinguish between acute anxiety responses and enduring trait anxiety, especially in longitudinal or developmental studies. Its normalized nature makes it ideal for comparing across cohorts with variable locomotor profiles, helping researchers detect true affective changes rather than activity-based confounds.
Rodents that spend more time in the center zone typically exhibit broader and more flexible exploration strategies. This behavior reflects not only reduced anxiety but also cognitive engagement and environmental curiosity. High center percentage is associated with robust spatial learning, attentional scanning, and memory encoding functions, supported by coordinated activation in the prefrontal cortex, hippocampus, and basal forebrain. In contrast, reduced center engagement may signal spatial rigidity, attentional narrowing, or cognitive withdrawal, particularly in models of neurodegeneration or aging.
The open field test remains one of the most widely accepted platforms for testing anxiolytic and psychotropic drugs. The percentage of center time reliably increases following administration of anxiolytic agents such as benzodiazepines, SSRIs, and GABA-A receptor agonists. This metric serves as a sensitive and reproducible endpoint in preclinical dose-finding studies, mechanistic pharmacology, and compound screening pipelines. It also aids in differentiating true anxiolytic effects from sedation or motor suppression by integrating with other behavioral parameters like distance traveled and entry count (Prut & Belzung, 2003).
Sex-based differences in emotional regulation often manifest in open field behavior, with female rodents generally exhibiting higher variability in center zone metrics due to hormonal cycling. For example, estrogen has been shown to facilitate exploratory behavior and increase center occupancy, while progesterone and stress-induced corticosterone often reduce it. Studies involving gonadectomy, hormone replacement, or sex-specific genetic knockouts use this metric to quantify the impact of endocrine factors on anxiety and exploratory behavior. As such, it remains a vital tool for dissecting sex-dependent neurobehavioral dynamics.
The percentage of center time is one of the most direct, unconditioned readouts of anxiety-like behavior in rodents. It is frequently reduced in models of PTSD, chronic stress, or early-life adversity. Because it is normalized, this metric is especially helpful for distinguishing between genuine avoidance and low general activity.
Environmental Control: Uniformity in environmental conditions is essential. Lighting should be evenly diffused to avoid shadow bias, and noise should be minimized to prevent stress-induced variability. The arena must be cleaned between trials using odor-neutral solutions to eliminate scent trails or pheromone cues that may affect zone preference. Any variation in these conditions can introduce systematic bias in center zone behavior. Use consistent definitions of the center zone (commonly 25% of total area) to allow valid comparisons. Software-based segmentation enhances spatial precision.
Evaluating how center time evolves across the duration of a session—divided into early, middle, and late thirds—provides insight into behavioral transitions and adaptive responses. Animals may begin by avoiding the center, only to gradually increase center time as they habituate to the environment. Conversely, persistently low center time across the session can signal prolonged anxiety, fear generalization, or a trait-like avoidance phenotype.
To validate the significance of center time percentage, it should be examined alongside results from other anxiety-related tests such as the Elevated Plus Maze, Light-Dark Box, or Novelty Suppressed Feeding. Concordance across paradigms supports the reliability of center time as a trait marker, while discordance may indicate task-specific reactivity or behavioral dissociation.
When paired with high-resolution scoring of behavioral events such as rearing, grooming, defecation, or immobility, center time offers a richer view of the animal’s internal state. For example, an animal that spends substantial time in the center while grooming may be coping with mild stress, while another that remains immobile in the periphery may be experiencing more severe anxiety. Microstructure analysis aids in decoding the complexity behind spatial behavior.
Animals naturally vary in their exploratory style. By analyzing percentage of center time across subjects, researchers can identify behavioral subgroups—such as consistently bold individuals who frequently explore the center versus cautious animals that remain along the periphery. These classifications can be used to examine predictors of drug response, resilience to stress, or vulnerability to neuropsychiatric disorders.
In studies with large cohorts or multiple behavioral variables, machine learning techniques such as hierarchical clustering or principal component analysis can incorporate center time percentage to discover novel phenotypic groupings. These data-driven approaches help uncover latent dimensions of behavior that may not be visible through univariate analyses alone.
Total locomotion helps contextualize center time. Low percentage values in animals with minimal movement may reflect sedation or fatigue, while similar values in high-mobility subjects suggest deliberate avoidance. This metric helps distinguish emotional versus motor causes of low center engagement.
This measure indicates how often the animal initiates exploration of the center zone. When combined with percentage of time, it differentiates between frequent but brief visits (indicative of anxiety or impulsivity) versus fewer but sustained center engagements (suggesting comfort and behavioral confidence).
The delay before the first center entry reflects initial threat appraisal. Longer latencies may be associated with heightened fear or low motivation, while shorter latencies are typically linked to exploratory drive or low anxiety.
Time spent hugging the walls offers a spatial counterbalance to center metrics. High thigmotaxis and low center time jointly support an interpretation of strong avoidance behavior. This inverse relationship helps triangulate affective and motivational states.
By expressing center zone activity as a proportion of total trial time, researchers gain a metric that is resistant to session variability and more readily comparable across time, treatment, and model conditions. This normalized measure enhances reproducibility and statistical power, particularly in multi-cohort or cross-laboratory designs.
For experimental designs aimed at assessing anxiety, exploratory strategy, or affective state, the percentage of time spent in the center offers one of the most robust and interpretable measures available in the Open Field Test.
Written by researchers, for researchers — powered by Conduct Science.


Monday – Friday
9 AM – 5 PM EST
DISCLAIMER: ConductScience and affiliate products are NOT designed for human consumption, testing, or clinical utilization. They are designed for pre-clinical utilization only. Customers purchasing apparatus for the purposes of scientific research or veterinary care affirm adherence to applicable regulatory bodies for the country in which their research or care is conducted.