

Bioenergetics is a branch of biochemistry that focuses on energy and energy supply in biological systems. The term first originated as the title of a 1957 novel written by the Nobel laureate Albert Szent-Györgyi.
It is the expansion of the chemiosmotic theory postulated in 1961, which originally explains how the generation and breakdown of the cellular energy currency, adenosine triphosphate (ATP), is coupled with the transport of electrons and hydrogen ions through the cell or organelle membrane.
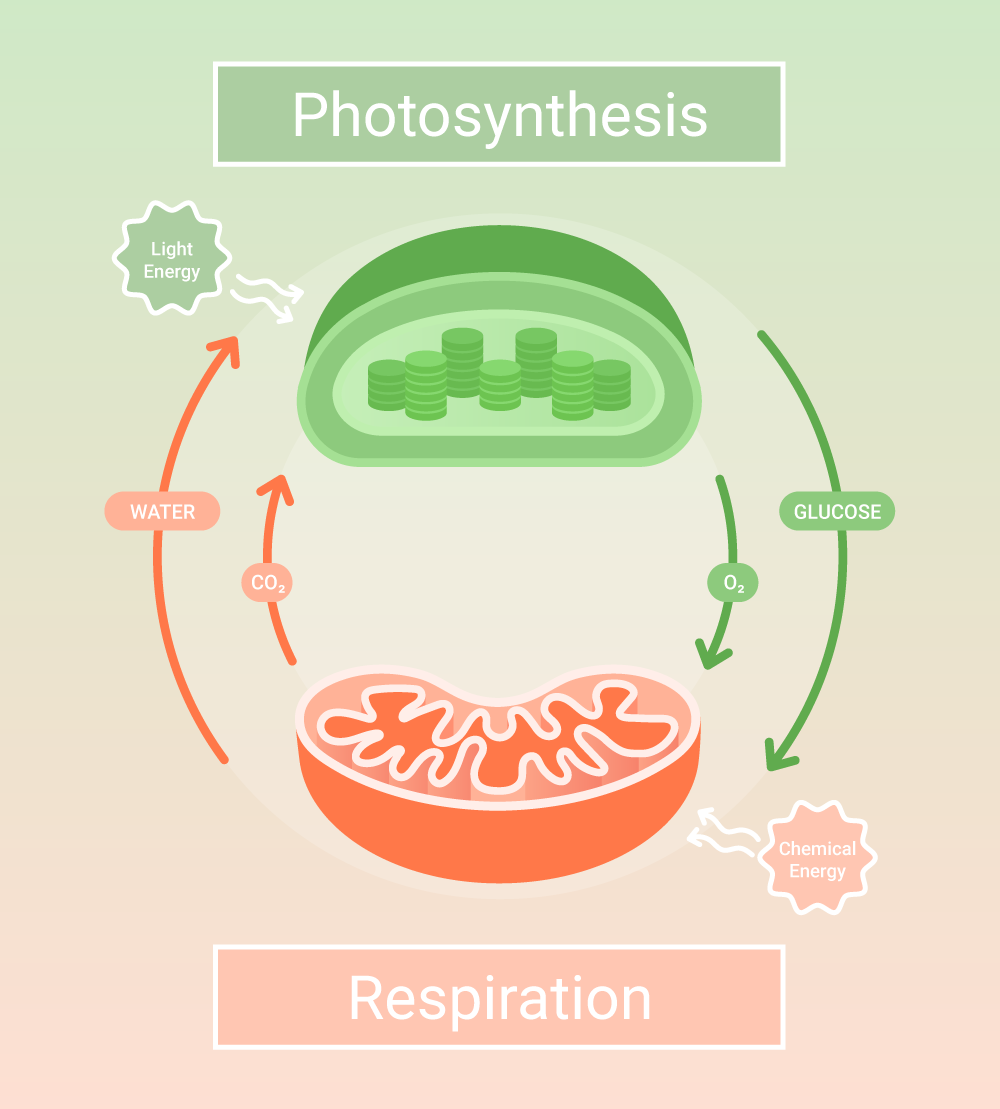
The subject field revolves around how biological systems acquire, store, and transduce energy to work and maintain energy balance. It also includes the breaking and synthesis of biomolecules in the cells and the mechanisms of energy transformation such as cellular respiration and photosynthesis.
The chemiosmotic theory is fundamental to our understanding of how biological systems use energy to achieve work. Such understanding is applicable in industrial processes and provides insights into health and well-being. Due to the impact of the chemiosmotic theory, Peter Mitchell, who proposed the theory, was awarded the 1978 Nobel Prize in Chemistry.[1-2]
Cellular energy can be potential or kinetic.
Potential energy is stationary, and it exists as chemical bonds, concentration gradients, and electrical charges in the cells.
Kinetic energy is energy in motion, which results in the movement of molecules. Heat or thermal energy, for example, causes molecules to oscillate. In the cells, kinetic energy is converted from potential energy, moving electrons, hydrogen ions, and other charged particles.[3-4]
From a thermodynamic point of view, energy is the capacity of a system to perform work. In biological and non-biological systems, energy behaves following the laws of thermodynamics, which are:[3]
Energy conservation is regarded as the first law of thermodynamics, which stipulates that energy is conserved. This means that energy readily exists and can neither be created nor destroyed. In other words, energy is transformed from one form to another or transferred from one system to another.
In thermodynamics, a system can be classified based on the exchange of energy and materials with another system as follows:
For instance, a coffee mug with a sealed lid can be regarded as a closed system because energy exchange with the immediate surroundings only occurs on the surface of the mug and the lid.
Without the lid, the coffee mug is now considered an open system. It is possible to add or remove materials from the system by drinking or adding ice cubes.
Removing or adding materials to the opened coffee mug causes energy transfer between the coffee mug and the surrounding systems, in addition to the energy exchange between the mug surface and the immediate surroundings.
The second law of thermodynamics states that only processes that increase the system entropy occur spontaneously.
As a result, reactions occur spontaneously only when they increase disorderliness or randomness (entropy) in the system and its surroundings. Otherwise, the system will require energy (technically termed Gibbs free energy) for non-spontaneous reactions.
The third thermodynamic law states that a pure, crystalline substance at absolute zero degrees (0 kelvin) is in a complete thermodynamic equilibrium point.
This law revolves around the thermodynamic equilibrium point, which occurs at the absolute zero degrees where there is no energy flow or matter exchange.
Since the absolute zero degrees is believed to be unattainable, this law implies that living cells are never in their complete thermodynamic equilibrium even when they seem to display no cellular activity.
Known as the Zeroth Law, it states that two separate objects in physical contact, which are in thermal equilibrium, are also in thermal equilibrium with a third object, provided that it is in physical contact with either object.
The most common observation of the Zeroth law is temperature measurement using a thermometer. To clarify, the temperature of a coffee is equal to the thermometer that is in direct contact with the coffee.
If the mug is filled with the coffee for quite some time (thermal equilibrium has been reached), its temperature equals that of the coffee inside. Similarly, the air in the immediate surrounding has the same temperature if the coffee mug is placed there a while.
The first and second thermodynamic laws (energy conservation and entropy expansion) are most relevant to bioenergetics.[2]
Based on the first law, all biological systems are thermodynamically open systems due to the constant matter and energy exchanges.
The second thermodynamic law can be applied to simplify the complexity of an open system by examining a chemical reaction or metabolic pathway as a closed system. In doing so, it is possible to calculate the energy requirements to eliminate proposed mechanisms that are not consistent with the thermodynamic laws.[3-4]
Nonetheless, other thermodynamic laws are relevant to bioenergetics and can be applied to bioenergetics to explain various biological phenomena.
For example, we know from the Zeroth and third law that energy is required to maintain a constant cellular or body temperature. The more active the process (farther the distance from the thermodynamic equilibrium point), the more energy it needs.[3]
Apart from the thermodynamic laws that provide the framework for bioenergetics, energetic cellular reactions also follow additional laws:[3]
The first bioenergetics law states that living cells do not use the acquired energy directly. Instead, the energy received from external sources is first converted into energy carriers before performing cellular works.
Three energy carriers are known to date:
Considered the molecular currency, ATP consists of adenine attached to one molecule of ribose sugar at carbon 1 and a triphosphate group at carbon 5, where energy is stored in the phosphoanhydride bonds.
Energy is released when the triphosphate group of the ATP is broken up into di- and monophosphate, resulting in adenosine diphosphate (ADP) and adenosine monophosphate (AMP), respectively.[3-4]
ATP is found in all types of living cells and is regarded as the universal sign of life. Most ATP molecules are synthesized by a membrane-bound enzyme complex, coupled with the translocation of hydrogen or sodium ions.[4]
Potential differences of protons or hydrogen ions (H+) are available as electrical and chemical potential differences.
The chemical potential difference results from the hydrogen ion concentration gradient, while the electrical potential difference stems from membrane potential. Electrical potential difference is generated because of charge separation between the extracellular matrix and the intracellular cytosol.[3]
Similar to the potential difference of hydrogen ions, sodium ion potential differences exist in electrical and chemical form. It is typically formed in association with cellular respiration and non-oxidative decarboxylation and uses the potassium-proton (K+/H+) gradient as a buffering system.[3]
The second law of bioenergetics states that all biological systems have at least two forms of energy carriers.
The third law of bioenergetics is expanded from the second law. It stipulates that energy carriers in one form can be converted to other forms that exist in the cells.
In short, ATP can be converted to potential differences of hydrogen ions or sodium ions and vice versa. It is thought that the interconversion between energy carriers guarantees that cells can fulfill all of their energy needs even if they can only harvest energy from one source.
At its core, bioenergetics deals with energy changes. Thus, bioenergetic reactions can be classified based on energy usage as follows:[2]
Exergonic reactions refer to chemical reactions that release free energy when they are complete. Hence, exergonic reactions can occur spontaneously in a closed system subjected to stable temperature and pressure.
From a metabolic point of view, exergonic reactions are in the catabolic branch, where macromolecules are dissimilated to smaller units. For example, starch and glycogen are broken down into glucose, their basic monomeric units.
In contrast to exergonic reactions, endergonic reactions are processes that consume energy. This sort of reaction will not occur in a thermostable closed system under constant pressure unless a sufficient amount of energy is given to the system.
From a metabolic point of view, endergonic reactions are anabolic. In anabolism, the energy released from catabolic reactions supplies the required energy for the synthesis of biomolecules.
Macromolecules such as proteins, carbohydrates, nucleic acids, and lipids are polymer chains that store energy in living cells. They are eventually used as reactants in catabolic reactions to supply the cells with energy.
Most, if not all bioenergetic processes involve the generation or consumption of ATP.[4]
ATP synthesis is an endergonic process that occurs together with an exergonic reaction. Similarly, the breakdown of ATP is coupled with an endergonic reaction.
The majority of cellular ATP is generated and hydrolyzed by membrane-bound protein complexes in a process called chemiosmosis.[1]
Chemiosmosis uses two proton pumps. The first pump generates ion gradients across the membrane that disturbs the system. This forces the second pump, the proton pump-ATPase (H+-ATPase), to generate ATP from a free phosphate to the ADP to restore the equilibrium.[3-4]
ATP is hydrolyzed when cells need the energy to initiate a non-spontaneous reaction. Water molecules in the cell act as electron donors, attacking and forming a chemical bond with one of the phosphate groups. The formation of a phosphate-hydroxide bond breaks the phosphate from ATP, releases the energy, and results in ADP and hydrogen ions.[3-4]
Cellular respiration refers to a catabolic process that cells use to harvest energy from biomolecules. Here, a series of reactions break up macromolecules into their basic units, transforming the potential energy embedded in the chemical bonds into ATPs and the cofactor nicotinamide adenine dinucleotide (NAD+).[2]
Cellular respiration in most organisms takes place in the presence of oxygen (aerobic respiration), consisting of the following pathways:[2]
Glycolysis is a metabolic pathway that harvests energy from glucose, and it results in ATP, the reduced form of NAD+ (NADH), and pyruvate.
Before glycolysis, polysaccharides are enzymatically digested into glucose. Glucose is converted into fructose upon entering glycolysis, and two ATP molecules are consumed to split the six-carbon fructose into two molecules of three-carbon triose sugar.
Each of the triose sugars undergoes phosphorylation. At the end of phosphorylation, one ATP is generated along with the reduction of NAD+ into NADH. The product, phosphoenolpyruvate, is eventually converted into pyruvate in the last step, giving rise to another ATP molecule.
As a whole, glycolysis results in four ATP molecules generated from substrate-level phosphorylation reactions, two NADH and two pyruvate molecules. Since two ATP molecules are consumed in the investing phase, glycolysis results in two net ATP molecules.[2,5]
The reduction of NAD+ into NADH from glycolysis disrupts the redox state and depletes the cellular NAD+ reserve. As a result, pyruvate is further oxidized to replenish the NAD+ reserve.
In eukaryotes, NADH and pyruvate are transferred to the mitochondria where they are oxidized to NAD+ and acetyl coenzyme A (acetyl-CoA) together with carbon dioxide (CO2), respectively. Acetyl CoA is further oxidized in the Citric Acid Cycle.[2,5]
In the absence of oxygen, fermentation, also known as anaerobic respiration, occurs to replenish the NAD+ pool and transform pyruvate into one of the following metabolites:[5]
Also known as the Krebs Cycle after Hans Adolf Krebs, the 1953 Nobel laureate who identified the cycle. The TCA cycle occurs at the mitochondrial membrane in aerobic respiration. It uses acetyl-CoA generated from glycolysis and pyruvate oxidation or the breakdown of lipids and amino acids.
Regarded as the central metabolic pathway, the Krebs cycle produces precursors of some amino acids, CO2, NADH, the hydroquinone form of flavin adenine dinucleotide (FADH2), and guanosine triphosphate (GTP) or ATP from substrate-level phosphorylation. NADH and FADH2 are subsequently used to synthesize ATP in oxidative phosphorylation.[2,6]
Following the TCA cycle, NADH and FADH2 created from the Krebs cycle are oxidized in a series of electron transfer reactions that ends with reducing oxygen (O2) into water, replenishing the cellular NAD+ and FAD pool, and producing ATP from chemiosmosis.
Oxidative phosphorylation in eukaryotes occurs in the mitochondria’s inner membrane and involves the transfer of electrons by a set of protein complexes called the electron transport chain. It consists of Complex I to IV, with ATP synthase in the vicinity. NADH is oxidized by Complex I, III, and IV and FADH2 by Complex II/III/IV.
The substrates supply their respective complexes with electrons as they are oxidized in a series of ‘downhill’ exergonic reactions until O2 is reduced to water in the final reaction.
Each electron transfer reaction is coupled with the transport of protons across the inner mitochondrial membrane, creating a proton gradient between the membrane. Eventually, the electromotive force generated by the proton gradient induces ATP synthase to synthesize ATP.[2,7]
Generally perceived as the opposite of cellular respiration, photosynthesis takes place when photoreceptors in chloroplasts capture light. The energy acquired from light excites electrons, resulting in charge separation and subsequent electron transport reactions, termed photophosphorylation.[2]
Photophosphorylation takes place at the thylakoid membrane of the chloroplast, where two protein complexes, Photosystem I (PSI) and Photosystem II (PSII), are located.
After light energy is harvested, the excitation and transfer of electrons lead to the oxidation of water to O2 and reduction of nicotinamide adenine dinucleotide phosphate (NADP+) to NADPH at the PSII and PSI, respectively.
Similar to oxidative phosphorylation, electron transfer in chloroplasts is coupled with the generation of proton gradients across the thylakoid membrane, which drives the generation of ATP by ATP synthase. Both NADPH and ATP are used in the Calvin cycle to generate starch.[2]
The conversion of energy for cellular activities is a vital process in any biological system. Failure to supply the required energy or excessive energy is consequential to the well-being of the organisms. Moreover, deficiency in the functioning of bioenergetic-related proteins can result in tremendous outcomes.
For instance:
Bioenergetics involves converting energy acquired from external sources for use in various biological processes in living cells. It is framed by the laws of thermodynamics but also follows other laws, including the use of energy currencies, which always exist in more than one interchangeable form.
In essence, the focal point of bioenergetic reactions is the transformation of potential to kinetic energy and vice versa. Such energy transformation is reflected in metabolic pathways, which are fundamental to the functioning of every biological system.
In behavioral neuroscience, the Open Field Test (OFT) remains one of the most widely used assays to evaluate rodent models of affect, cognition, and motivation. It provides a non-invasive framework for examining how animals respond to novelty, stress, and pharmacological or environmental manipulations. Among the test’s core metrics, the percentage of time spent in the center zone offers a uniquely normalized and sensitive measure of an animal’s emotional reactivity and willingness to engage with a potentially risky environment.
This metric is calculated as the proportion of time spent in the central area of the arena—typically the inner 25%—relative to the entire session duration. By normalizing this value, researchers gain a behaviorally informative variable that is resilient to fluctuations in session length or overall movement levels. This makes it especially valuable in comparative analyses, longitudinal monitoring, and cross-model validation.
Unlike raw center duration, which can be affected by trial design inconsistencies, the percentage-based measure enables clearer comparisons across animals, treatments, and conditions. It plays a key role in identifying trait anxiety, avoidance behavior, risk-taking tendencies, and environmental adaptation, making it indispensable in both basic and translational research contexts.
Whereas simple center duration provides absolute time, the percentage-based metric introduces greater interpretability and reproducibility, especially when comparing different animal models, treatment conditions, or experimental setups. It is particularly effective for quantifying avoidance behaviors, risk assessment strategies, and trait anxiety profiles in both acute and longitudinal designs.
This metric reflects the relative amount of time an animal chooses to spend in the open, exposed portion of the arena—typically defined as the inner 25% of a square or circular enclosure. Because rodents innately prefer the periphery (thigmotaxis), time in the center is inversely associated with anxiety-like behavior. As such, this percentage is considered a sensitive, normalized index of:
Critically, because this metric is normalized by session duration, it accommodates variability in activity levels or testing conditions. This makes it especially suitable for comparing across individuals, treatment groups, or timepoints in longitudinal studies.
A high percentage of center time indicates reduced anxiety, increased novelty-seeking, or pharmacological modulation (e.g., anxiolysis). Conversely, a low percentage suggests emotional inhibition, behavioral avoidance, or contextual hypervigilance. reduced anxiety, increased novelty-seeking, or pharmacological modulation (e.g., anxiolysis). Conversely, a low percentage suggests emotional inhibition, behavioral avoidance, or contextual hypervigilance.
The percentage of center time is one of the most direct, unconditioned readouts of anxiety-like behavior in rodents. It is frequently reduced in models of PTSD, chronic stress, or early-life adversity, where animals exhibit persistent avoidance of the center due to heightened emotional reactivity. This metric can also distinguish between acute anxiety responses and enduring trait anxiety, especially in longitudinal or developmental studies. Its normalized nature makes it ideal for comparing across cohorts with variable locomotor profiles, helping researchers detect true affective changes rather than activity-based confounds.
Rodents that spend more time in the center zone typically exhibit broader and more flexible exploration strategies. This behavior reflects not only reduced anxiety but also cognitive engagement and environmental curiosity. High center percentage is associated with robust spatial learning, attentional scanning, and memory encoding functions, supported by coordinated activation in the prefrontal cortex, hippocampus, and basal forebrain. In contrast, reduced center engagement may signal spatial rigidity, attentional narrowing, or cognitive withdrawal, particularly in models of neurodegeneration or aging.
The open field test remains one of the most widely accepted platforms for testing anxiolytic and psychotropic drugs. The percentage of center time reliably increases following administration of anxiolytic agents such as benzodiazepines, SSRIs, and GABA-A receptor agonists. This metric serves as a sensitive and reproducible endpoint in preclinical dose-finding studies, mechanistic pharmacology, and compound screening pipelines. It also aids in differentiating true anxiolytic effects from sedation or motor suppression by integrating with other behavioral parameters like distance traveled and entry count (Prut & Belzung, 2003).
Sex-based differences in emotional regulation often manifest in open field behavior, with female rodents generally exhibiting higher variability in center zone metrics due to hormonal cycling. For example, estrogen has been shown to facilitate exploratory behavior and increase center occupancy, while progesterone and stress-induced corticosterone often reduce it. Studies involving gonadectomy, hormone replacement, or sex-specific genetic knockouts use this metric to quantify the impact of endocrine factors on anxiety and exploratory behavior. As such, it remains a vital tool for dissecting sex-dependent neurobehavioral dynamics.
The percentage of center time is one of the most direct, unconditioned readouts of anxiety-like behavior in rodents. It is frequently reduced in models of PTSD, chronic stress, or early-life adversity. Because it is normalized, this metric is especially helpful for distinguishing between genuine avoidance and low general activity.
Environmental Control: Uniformity in environmental conditions is essential. Lighting should be evenly diffused to avoid shadow bias, and noise should be minimized to prevent stress-induced variability. The arena must be cleaned between trials using odor-neutral solutions to eliminate scent trails or pheromone cues that may affect zone preference. Any variation in these conditions can introduce systematic bias in center zone behavior. Use consistent definitions of the center zone (commonly 25% of total area) to allow valid comparisons. Software-based segmentation enhances spatial precision.
Evaluating how center time evolves across the duration of a session—divided into early, middle, and late thirds—provides insight into behavioral transitions and adaptive responses. Animals may begin by avoiding the center, only to gradually increase center time as they habituate to the environment. Conversely, persistently low center time across the session can signal prolonged anxiety, fear generalization, or a trait-like avoidance phenotype.
To validate the significance of center time percentage, it should be examined alongside results from other anxiety-related tests such as the Elevated Plus Maze, Light-Dark Box, or Novelty Suppressed Feeding. Concordance across paradigms supports the reliability of center time as a trait marker, while discordance may indicate task-specific reactivity or behavioral dissociation.
When paired with high-resolution scoring of behavioral events such as rearing, grooming, defecation, or immobility, center time offers a richer view of the animal’s internal state. For example, an animal that spends substantial time in the center while grooming may be coping with mild stress, while another that remains immobile in the periphery may be experiencing more severe anxiety. Microstructure analysis aids in decoding the complexity behind spatial behavior.
Animals naturally vary in their exploratory style. By analyzing percentage of center time across subjects, researchers can identify behavioral subgroups—such as consistently bold individuals who frequently explore the center versus cautious animals that remain along the periphery. These classifications can be used to examine predictors of drug response, resilience to stress, or vulnerability to neuropsychiatric disorders.
In studies with large cohorts or multiple behavioral variables, machine learning techniques such as hierarchical clustering or principal component analysis can incorporate center time percentage to discover novel phenotypic groupings. These data-driven approaches help uncover latent dimensions of behavior that may not be visible through univariate analyses alone.
Total locomotion helps contextualize center time. Low percentage values in animals with minimal movement may reflect sedation or fatigue, while similar values in high-mobility subjects suggest deliberate avoidance. This metric helps distinguish emotional versus motor causes of low center engagement.
This measure indicates how often the animal initiates exploration of the center zone. When combined with percentage of time, it differentiates between frequent but brief visits (indicative of anxiety or impulsivity) versus fewer but sustained center engagements (suggesting comfort and behavioral confidence).
The delay before the first center entry reflects initial threat appraisal. Longer latencies may be associated with heightened fear or low motivation, while shorter latencies are typically linked to exploratory drive or low anxiety.
Time spent hugging the walls offers a spatial counterbalance to center metrics. High thigmotaxis and low center time jointly support an interpretation of strong avoidance behavior. This inverse relationship helps triangulate affective and motivational states.
By expressing center zone activity as a proportion of total trial time, researchers gain a metric that is resistant to session variability and more readily comparable across time, treatment, and model conditions. This normalized measure enhances reproducibility and statistical power, particularly in multi-cohort or cross-laboratory designs.
For experimental designs aimed at assessing anxiety, exploratory strategy, or affective state, the percentage of time spent in the center offers one of the most robust and interpretable measures available in the Open Field Test.
Written by researchers, for researchers — powered by Conduct Science.


Monday – Friday
9 AM – 5 PM EST
DISCLAIMER: ConductScience and affiliate products are NOT designed for human consumption, testing, or clinical utilization. They are designed for pre-clinical utilization only. Customers purchasing apparatus for the purposes of scientific research or veterinary care affirm adherence to applicable regulatory bodies for the country in which their research or care is conducted.