

Passive transport is the process of transporting molecules from one side of the membrane to the other without any energy requirements.
The transport of materials across the cell membrane is necessary to uphold cellular homeostasis.[1] It’s required to maintain the pH, volume, and accumulation of nutrients for protein synthesis and cell metabolism for organisms to thrive.[1]
The cell membrane is composed of lipids, proteins, carbohydrates, and sterols that interact with each other to facilitate transmembrane transport.[1] The phospholipid bilayer of the membrane has hydrophilic lipid heads facing outside and the hydrophobic tails facing towards each other on the inner leaflet of the membrane. This orientation supports the amphipathic nature of the biological membrane.[1]
The hydrophobicity of the membrane makes it challenging to transport ions, solutes, and other hydrophilic molecules across the membrane, making it selectively permeable.[1] Membrane permeability which is affected by several factors is the physiological property that allows the selective passage of hydrophilic solutes across the hydrophobic barrier. Transport proteins like carriers and channel proteins facilitate the transport of such hydrophilic molecules.[1]
This article provides an in-depth discussion about passive transport, its types, and the molecules or ions it supports to cross the membrane.
Humans, animals, plants, and other organisms utilize different means of transporting materials from one place to another. This unique transportation network circulates food, minerals, hormones, oxygen, carbon dioxide, waste products, etc.[1]
The movement of molecules across the membrane is categorized into two classes, depending on the energy required to execute the process. It includes active transport and passive transport.
It’s the transport of molecules across the membrane against the concentration gradient from low concentration to high concentration. It involves an expenditure of energy in the form of ATP.
The two types of active transport include:
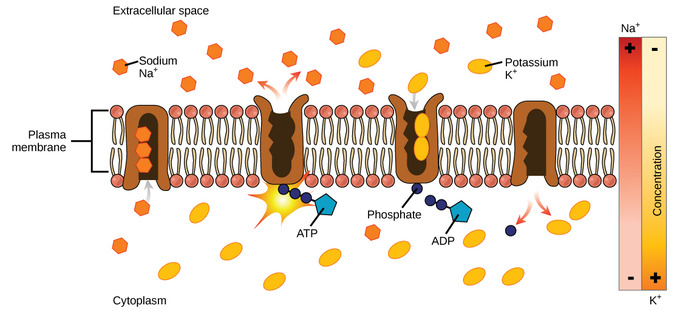
Image: An illustration of sodium-potassium transport against the electrochemical gradient using ATP as energy.[2]
Source: Courses Lumen Learning
Secondary (indirect) active transport: It involves coupling the transport of one molecule with another. The energy-dependent transfer of an ion (Na+, K+, or H+) generates an electrochemical gradient of the ion across the membrane.[3] This ion gradient is coupled to the movement of solutes on the same side (symport) or opposite side (antiport) of the membrane.[3]
It’s the movement of substances across the membrane along the concentration gradient from higher concentration to lower concentration. Thus, it doesn’t require energy.
Passive transport is involved in transferring small molecules of low molecular weight and gases across the membrane. But, instead of utilizing cellular energy, the process relies on the second law of thermodynamics to drive the movement of substance.
Fick’s law of diffusion predicts the rate of diffusion through passive transport. It states that the molar flux due to diffusion is proportional to the concentration gradient.
The two types of passive transport include diffusion and facilitated diffusion.
It’s the movement of materials from an area of high concentration to that of low concentration until the concentration is equal on both sides (gradient neutralization). Diffusion requires no energy expenses; instead, the concentration gradient (in the form of potential energy) is created and utilized during the transport of molecules.[4]
In simple diffusion, molecules or solute particles move in random Brownian motion. And, their flux across the membrane can be calculated using an equation proposed by Torrell in 1953.[4]
Flux = Mobility x Concentration x Driving Force
Here, flux is the number of moles of solute crossing one square centimeter of membrane per second. The concentration measures the amount of material available to participate in the diffusion process, while solute mobility is the ease of transport of molecules.[4]
The difference in the concentration gradient on both sides of the membrane acts as a driving force for molecular transport. When the solute equilibrium is achieved on both sides of the membrane, the flux across the membrane becomes zero.[5]
Simple diffusion occurs only in liquid and gases because of random movements of their particles from one place to another. Examples of molecules transported by simple diffusion include oxygen, carbon dioxide, and ethanol.[5]
Another example of simple diffusion is the transport of water, nutrients, and other gases in prokaryotes like bacteria. In addition, the excretion of waste material is also through simple diffusion in these organisms.[5]
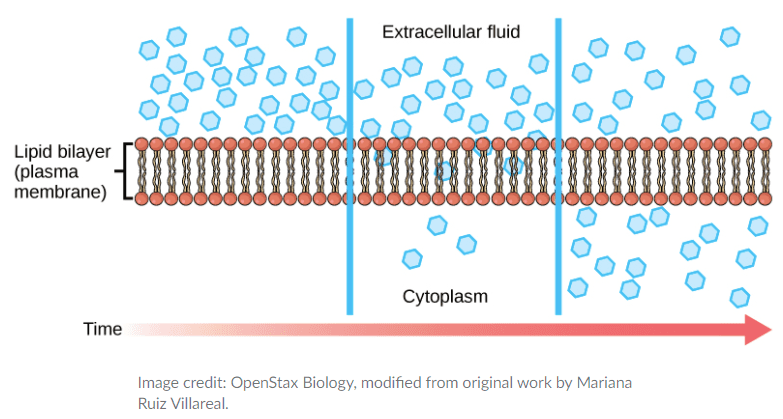
Image: An illustration of simple diffusion through lipid bilayer membrane.[2]
Source: Courses Lumen Learning
Channel-mediated transport is the spontaneous passage of molecules or ions across the biological membrane passing through specific transmembrane integral proteins.[4] These integral proteins are collectively known as transport proteins.
Channel proteins are specific for the materials they transport across the membrane. Structurally, they have hydrophilic domains exposed to the intracellular and extracellular fluids and a hydrophobic channel through their core that provides a hydrated opening through the membrane layers.[4]
The passage created by both domains prevents the polar molecules from coming in contact with the non-polar central layer of the membrane.[4] An example of channel-mediated transport is the passage of water through aquaporins.
Channel proteins are also of two types:
In the kidney, both gated and non-gated channels are found in different parts of the renal tubules. In contrast, nerve cells and muscle cells involved in the transmission of electric impulses have gated channels for sodium, potassium, and calcium in their membranes.
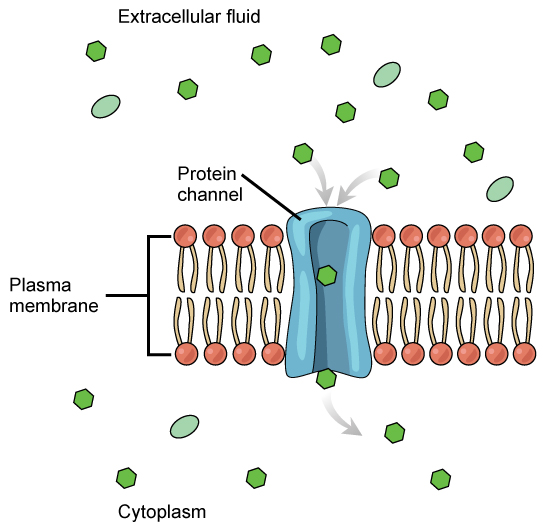
Image: An illustration of channel-mediated transport.[2]
Source: Courses Lumen Learning
The carrier protein bind to the molecules to be transferred that eventually triggers a change in its shape. Then, based on the concentration gradient, the molecule moves across the membrane.
An example of carrier-mediated transport is a group of carrier proteins called glucose transport proteins, or GLUTs, which transport glucose and other hexose sugars through plasma membranes within the body.[4]
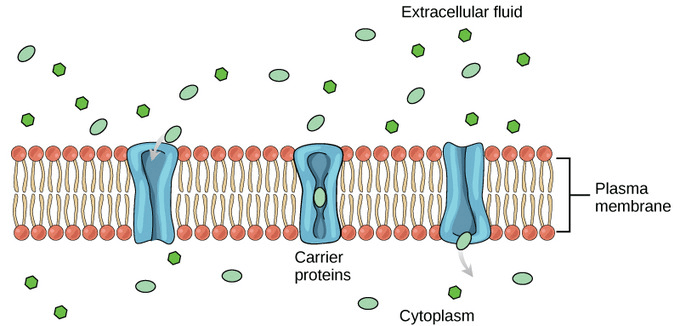
Image: An illustration of carrier-mediated transport.[2]
Source: Courses Lumen Learning
The process of facilitated diffusion depends on several factors like:[7]
The simple diffusion and facilitated diffusion process might seem similar, but there are four significant differences among both techniques. They are:[6]
Other than simple and facilitated diffusion, osmosis and filtration are two other techniques that work on the principle of passive transport. They are also involved in the transfer of certain molecules across biological membranes based on concentration gradient and without any energy expenditure.
It’s a process of transporting solvent molecules from an area of high water potential (lower solute concentration) to lower water potential (higher solute concentration) through a selectively permeable membrane. Any type of gases and supercritical liquids like CO2 can cross the membrane or any other system through the process of osmosis.
The osmotic solutions are of three types:[8]
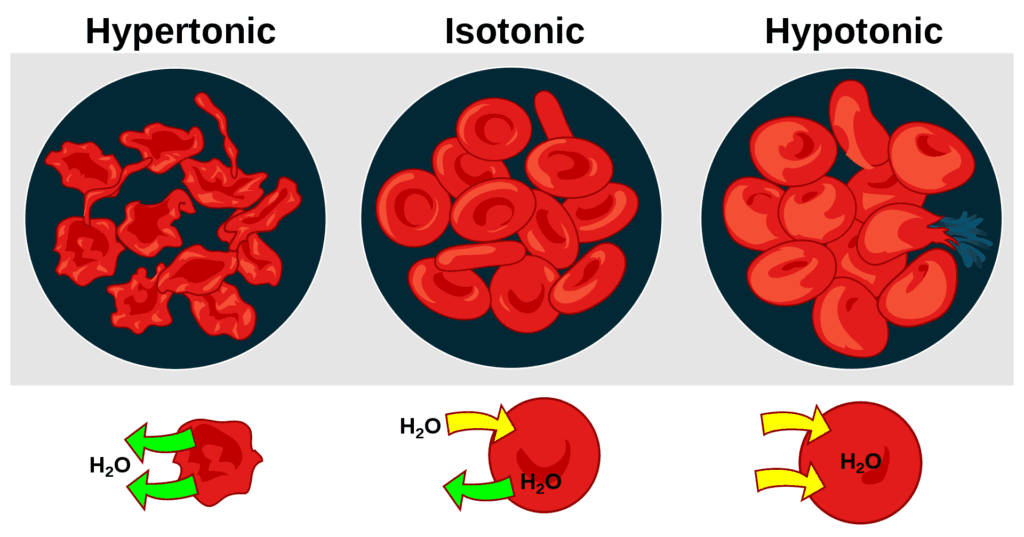
Image: An illustration of the effect of blood cells when placed in solutions of different tonicity.
Source: Wikipedia[9]
Depending on the physiological mechanism occurring in a cell when placed in an osmotic solution, the process of osmosis is of two types:[9]
Stomatal opening in plant cells is an example of osmosis. Here, water enters the cell through osmosis, the guard cells swell up, and the stomata open for the gaseous exchange. Another example is the absorption of water from the soil.[9]
Filtration is the process of separating solids from liquids and gases. It doesn’t require energy expenditure and takes place along the concentration gradient.[10] An example includes the selective absorption of nutrients in the human body. The glomerulus filters the blood in the kidney, and the body reabsorbs the necessary molecules.[10]
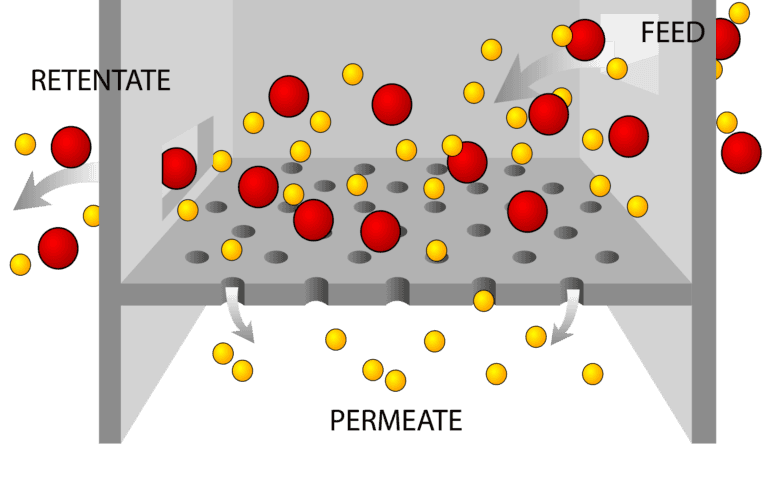
Image: An illustration of the process of filtration.[9]
Source: Wikipedia
Passive transport is a physiological mechanism of transporting molecules across the membrane that favors the concentration gradient. Without any expenditure of energy, the process transfers essential molecules, nutrients, and gases to the organism’s body required for their living. However, channel and carrier proteins present in the membrane also facilitate this transport.
The transport rate depends on the permeability of the cell membrane, which, in turn, depends on the organization and characteristics of membrane lipids and proteins.
Researchers are currently digging up more hidden properties of the membrane and studying their utilization for drug transport during disease treatment. So, despite being an old matter, the area has the novel potential for breakthroughs in health and medicine.
In behavioral neuroscience, the Open Field Test (OFT) remains one of the most widely used assays to evaluate rodent models of affect, cognition, and motivation. It provides a non-invasive framework for examining how animals respond to novelty, stress, and pharmacological or environmental manipulations. Among the test’s core metrics, the percentage of time spent in the center zone offers a uniquely normalized and sensitive measure of an animal’s emotional reactivity and willingness to engage with a potentially risky environment.
This metric is calculated as the proportion of time spent in the central area of the arena—typically the inner 25%—relative to the entire session duration. By normalizing this value, researchers gain a behaviorally informative variable that is resilient to fluctuations in session length or overall movement levels. This makes it especially valuable in comparative analyses, longitudinal monitoring, and cross-model validation.
Unlike raw center duration, which can be affected by trial design inconsistencies, the percentage-based measure enables clearer comparisons across animals, treatments, and conditions. It plays a key role in identifying trait anxiety, avoidance behavior, risk-taking tendencies, and environmental adaptation, making it indispensable in both basic and translational research contexts.
Whereas simple center duration provides absolute time, the percentage-based metric introduces greater interpretability and reproducibility, especially when comparing different animal models, treatment conditions, or experimental setups. It is particularly effective for quantifying avoidance behaviors, risk assessment strategies, and trait anxiety profiles in both acute and longitudinal designs.
This metric reflects the relative amount of time an animal chooses to spend in the open, exposed portion of the arena—typically defined as the inner 25% of a square or circular enclosure. Because rodents innately prefer the periphery (thigmotaxis), time in the center is inversely associated with anxiety-like behavior. As such, this percentage is considered a sensitive, normalized index of:
Critically, because this metric is normalized by session duration, it accommodates variability in activity levels or testing conditions. This makes it especially suitable for comparing across individuals, treatment groups, or timepoints in longitudinal studies.
A high percentage of center time indicates reduced anxiety, increased novelty-seeking, or pharmacological modulation (e.g., anxiolysis). Conversely, a low percentage suggests emotional inhibition, behavioral avoidance, or contextual hypervigilance. reduced anxiety, increased novelty-seeking, or pharmacological modulation (e.g., anxiolysis). Conversely, a low percentage suggests emotional inhibition, behavioral avoidance, or contextual hypervigilance.
The percentage of center time is one of the most direct, unconditioned readouts of anxiety-like behavior in rodents. It is frequently reduced in models of PTSD, chronic stress, or early-life adversity, where animals exhibit persistent avoidance of the center due to heightened emotional reactivity. This metric can also distinguish between acute anxiety responses and enduring trait anxiety, especially in longitudinal or developmental studies. Its normalized nature makes it ideal for comparing across cohorts with variable locomotor profiles, helping researchers detect true affective changes rather than activity-based confounds.
Rodents that spend more time in the center zone typically exhibit broader and more flexible exploration strategies. This behavior reflects not only reduced anxiety but also cognitive engagement and environmental curiosity. High center percentage is associated with robust spatial learning, attentional scanning, and memory encoding functions, supported by coordinated activation in the prefrontal cortex, hippocampus, and basal forebrain. In contrast, reduced center engagement may signal spatial rigidity, attentional narrowing, or cognitive withdrawal, particularly in models of neurodegeneration or aging.
The open field test remains one of the most widely accepted platforms for testing anxiolytic and psychotropic drugs. The percentage of center time reliably increases following administration of anxiolytic agents such as benzodiazepines, SSRIs, and GABA-A receptor agonists. This metric serves as a sensitive and reproducible endpoint in preclinical dose-finding studies, mechanistic pharmacology, and compound screening pipelines. It also aids in differentiating true anxiolytic effects from sedation or motor suppression by integrating with other behavioral parameters like distance traveled and entry count (Prut & Belzung, 2003).
Sex-based differences in emotional regulation often manifest in open field behavior, with female rodents generally exhibiting higher variability in center zone metrics due to hormonal cycling. For example, estrogen has been shown to facilitate exploratory behavior and increase center occupancy, while progesterone and stress-induced corticosterone often reduce it. Studies involving gonadectomy, hormone replacement, or sex-specific genetic knockouts use this metric to quantify the impact of endocrine factors on anxiety and exploratory behavior. As such, it remains a vital tool for dissecting sex-dependent neurobehavioral dynamics.
The percentage of center time is one of the most direct, unconditioned readouts of anxiety-like behavior in rodents. It is frequently reduced in models of PTSD, chronic stress, or early-life adversity. Because it is normalized, this metric is especially helpful for distinguishing between genuine avoidance and low general activity.
Environmental Control: Uniformity in environmental conditions is essential. Lighting should be evenly diffused to avoid shadow bias, and noise should be minimized to prevent stress-induced variability. The arena must be cleaned between trials using odor-neutral solutions to eliminate scent trails or pheromone cues that may affect zone preference. Any variation in these conditions can introduce systematic bias in center zone behavior. Use consistent definitions of the center zone (commonly 25% of total area) to allow valid comparisons. Software-based segmentation enhances spatial precision.
Evaluating how center time evolves across the duration of a session—divided into early, middle, and late thirds—provides insight into behavioral transitions and adaptive responses. Animals may begin by avoiding the center, only to gradually increase center time as they habituate to the environment. Conversely, persistently low center time across the session can signal prolonged anxiety, fear generalization, or a trait-like avoidance phenotype.
To validate the significance of center time percentage, it should be examined alongside results from other anxiety-related tests such as the Elevated Plus Maze, Light-Dark Box, or Novelty Suppressed Feeding. Concordance across paradigms supports the reliability of center time as a trait marker, while discordance may indicate task-specific reactivity or behavioral dissociation.
When paired with high-resolution scoring of behavioral events such as rearing, grooming, defecation, or immobility, center time offers a richer view of the animal’s internal state. For example, an animal that spends substantial time in the center while grooming may be coping with mild stress, while another that remains immobile in the periphery may be experiencing more severe anxiety. Microstructure analysis aids in decoding the complexity behind spatial behavior.
Animals naturally vary in their exploratory style. By analyzing percentage of center time across subjects, researchers can identify behavioral subgroups—such as consistently bold individuals who frequently explore the center versus cautious animals that remain along the periphery. These classifications can be used to examine predictors of drug response, resilience to stress, or vulnerability to neuropsychiatric disorders.
In studies with large cohorts or multiple behavioral variables, machine learning techniques such as hierarchical clustering or principal component analysis can incorporate center time percentage to discover novel phenotypic groupings. These data-driven approaches help uncover latent dimensions of behavior that may not be visible through univariate analyses alone.
Total locomotion helps contextualize center time. Low percentage values in animals with minimal movement may reflect sedation or fatigue, while similar values in high-mobility subjects suggest deliberate avoidance. This metric helps distinguish emotional versus motor causes of low center engagement.
This measure indicates how often the animal initiates exploration of the center zone. When combined with percentage of time, it differentiates between frequent but brief visits (indicative of anxiety or impulsivity) versus fewer but sustained center engagements (suggesting comfort and behavioral confidence).
The delay before the first center entry reflects initial threat appraisal. Longer latencies may be associated with heightened fear or low motivation, while shorter latencies are typically linked to exploratory drive or low anxiety.
Time spent hugging the walls offers a spatial counterbalance to center metrics. High thigmotaxis and low center time jointly support an interpretation of strong avoidance behavior. This inverse relationship helps triangulate affective and motivational states.
By expressing center zone activity as a proportion of total trial time, researchers gain a metric that is resistant to session variability and more readily comparable across time, treatment, and model conditions. This normalized measure enhances reproducibility and statistical power, particularly in multi-cohort or cross-laboratory designs.
For experimental designs aimed at assessing anxiety, exploratory strategy, or affective state, the percentage of time spent in the center offers one of the most robust and interpretable measures available in the Open Field Test.
Written by researchers, for researchers — powered by Conduct Science.


Monday – Friday
9 AM – 5 PM EST
DISCLAIMER: ConductScience and affiliate products are NOT designed for human consumption, testing, or clinical utilization. They are designed for pre-clinical utilization only. Customers purchasing apparatus for the purposes of scientific research or veterinary care affirm adherence to applicable regulatory bodies for the country in which their research or care is conducted.