x
[quotes_form]
Photosynthesis-and-Respiration

Stages of Photosynthesis and Factors Influencing It

See our Environmental Science Products

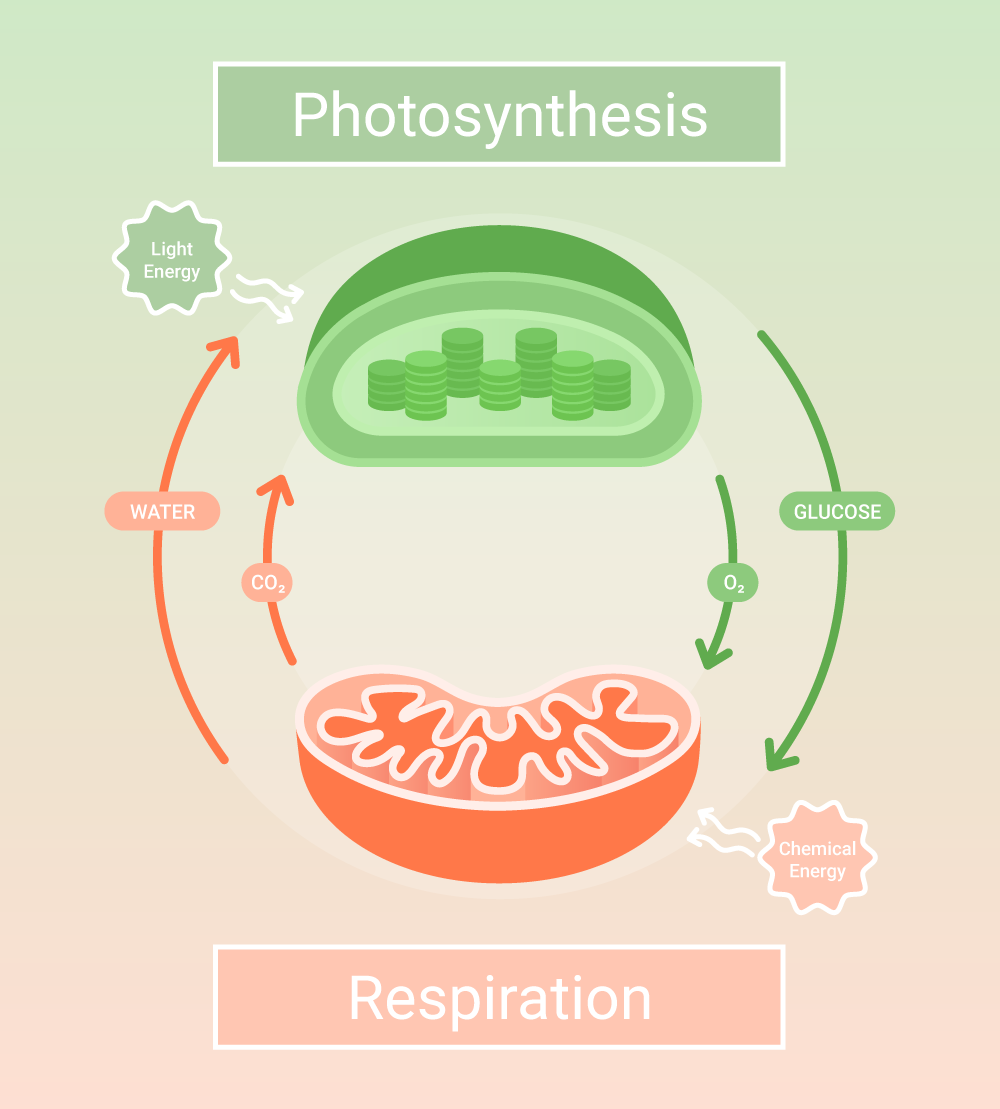
Photosynthesis is a series of biochemical reactions that photosynthetic autotrophs use to convert solar energy into potential energy, and it involves two stages.

In the first stage, called light-dependent reactions, autotrophs capture energy from sunlight. And in the second stage, light-independent or dark reactions, the captured solar energy is converted into potential energy, which exists in autotrophs as chemical bonds in macromolecules.

Most of the macromolecules synthesized from photosynthesis are carbohydrates, but autotrophs can also produce proteins and lipids. These macromolecules are consumed by the autotrophs in their metabolic reactions and utilized by heterotrophs as food and other non-food products.

Glossary
Chloroplast
A double-membrane organelle in photosynthetic eukaryotes such as plants where photosynthesis takes place.
Granum (pl. grana)
A stack of a flattened sac-like structure called thylakoids in the chloroplast.
Proplastid
An immature organelle found in eukaryotic autotrophs that contains no pigments, which matures and differentiates into chloroplasts and other plastids.
Photon
An elementary particle or quantum of light which displays the properties of waves and particles. It is regarded as the smallest quantity of light.
Phosphorylation
A chemical process of attaching a phosphate group in a cell. The inverse of the reaction is termed dephosphorylation.
Photoreceptor
A light-sensitive protein complex that senses and responds to the presence of light.
Photophosphorylation
A cellular chemical reaction that synthesizes ATP from the phosphorylation of ADP using solar energy.
Thylakoid
A membrane-bound hollow disk-shaped structure in the chloroplast where photosynthesis in eukaryotes takes place.
Stroma
A fluid that fills the inside of the chloroplast inner membrane.

What is Photosynthesis?

Photosynthesis occurs in autotrophs, which are organisms that are capable of producing their own food. They include archaea, prokaryotes such as purple bacteria, acidobacteria, and cyanobacteria, and eukaryotes such as algae and land plants.

Photosynthesis can be either anoxygenic or oxygenic. Anoxygenic photosynthesis does not require water or produce O2, and apart from cyanobacteria, photosynthesis in non-eukaryotes is anoxygenic.

Oxygenic photosynthesis is considered the reversal of glycolysis in cellular respiration. It captures energy from sunlight and uses it to convert CO2 into sugar and oxygen in the presence of water.

 There are two stages of photosynthesis, which can be summarized as follows:[1,2]  

  (CO)2 + nH2O →(CH2O)n +O2;

where n represents the number of molecules.

In the first stage (light-dependent), the photoreceptors harvest energy from sunlight, and the harvested energy oxidizes water into oxygen (O2) and triggers the transfer of electrons. This leads to the reduction of nicotinamide adenine dinucleotide phosphate (NADP+) and the synthesis of adenosine triphosphate (ATP) from adenosine diphosphate (ADP) phosphorylation, in a reaction termed photophosphorylation.  

The second stage, the light-independent reactions, are a part of the Calvin cycle. The reactions occur without the direct involvement of sunlight. Instead, the ATPs and NADPH generated in the light reactions are consumed to synthesize sugar from carbon dioxide (CO2). The resulting ADP and NADP+ are recycled to resupply the transfer of electrons in light-dependent reactions.[1]

Photosynthesis in Eukaryotes Occurs in Chloroplasts

Photosynthesis in eukaryotes takes place in chloroplast, an organelle genetically similar to cyanobacteria, leading to the endosymbiotic hypothesis which says that the origin of chloroplasts is comparable to that of mitochondria.

In particular, chloroplasts originated from heterotrophic eukaryotes that took up photosynthetic cyanobacteria. After endosymbiosis, the bacteria lost their ability to live independently, transforming the host eukaryotes from heterotrophs into autotrophs.[3]  

Structural features of chloroplasts

Figure 1: Structural Features of Chloroplasts in Photosynthetic Autotrophs 

Similar to mitochondria, chloroplasts possess two layers of membranes, the outer and inner membrane. The outer membrane encloses the stroma, which contains several grana and other proteins. Each granum consists of a stack of thylakoids, a flattened sac-like structure, and the aqueous space in each thylakoid is called thylakoid lumen; however, the environment inside the thylakoid lumen is acidic (Figure 1)

Chloroplasts are present in cells and tissues involved in photosynthesis, for example, the guard cells and mesophylls in the leaf epidermis. They are differentiated from immature colorless plastids, called proplastids, and contain pigments that are predominantly chlorophylls, which give plants their green color.[1,2]

Photosynthetic pigments capture photons.

The sun radiates energy as electromagnetic waves, consisting of multiple wavelengths that inversely correspond to energy level. The smallest unit of energy carried by light is quantified in terms of light quanta or photons. Photosynthesis in most autotrophs uses visible light, whose wavelengths range from 350 to 800 nanometers.[4]  

Chlorophylls serve as the primary pigments that absorb light and capture photons in algae, cyanobacteria, and plants. They have a porphyrin ring consisting of four pyrroles that coordinate with one magnesium ion (Mg2+) in the center.

The ring has a long hydrocarbon side chain with one double carbon-carbon bond that enables chlorophylls to be solubilized in lipids and embedded in the thylakoid membrane.[1]     

Two predominant chlorophyll species are found in plants and algae:[1]  

  1. Chlorophyll a is distinguished by a methyl group attached to one of the four pyrrole rings. It is the most prevalent chlorophyll species in plants and the only one present in the photosynthetic reaction centers. Chlorophyll a absorbs the most light at 372 and 642 nanometers, corresponding to violet-blue and orange lights, respectively.[1,4]   
  2. Chlorophyll b is characterized by a formyl group attached to the porphyrin ring in the same position as the methyl group in chlorophyll a. The substitution of the formyl group shifts the optimal light-absorbing ranges in chlorophyll b to 392 and 626 nanometers, corresponding to blue and red lights, respectively.[1,4]      

Apart from chlorophylls, other accessory pigments are also present in photosynthetic cells. These accessory pigments absorb visible light of different wavelengths, supporting the energy capturing process. Accessory pigments can prevent intense or excessive light from damaging chlorophylls and photosynthetic components by reducing free radicals.[1, 2]    

Examples of accessory pigments are:[1,2]  

  • Carotenoids are pigments that absorb blue-green and violet lights, corresponding to 400 to 500 nanometers. They give algae and plants yellow, orange, and red colors. Examples are carotenes which are unsaturated hydrocarbons carotenoids, and xanthophylls which are oxygenated carotenoids.
  • Phycobilins are red pigments that absorb lights in the 550 to 630 nanometers range. Unlike carotenoids, phycobilins are found only in red algae and some unicellular algae (like cryptomonads) but not in plants or green algae.

Since all photosynthetic pigments absorb light at different wavelengths, the combined light-absorbing action of all pigments will allow organisms to maximize the capturing of photons.[1]  

Mechanisms of Photosynthesis

Photosynthesis mechanisms can be divided into two stages based on the light requirement. The two stages of photosynthesis are connected by two high-energy molecules, ATP and NADPH (Figure 2). Both ATP and NADPH are consumed in the second stage when hexose sugar is synthesized. Hexose sugars are building blocks for the synthesis of complex carbohydrates.

Illustration on the mechanism of photosynthesis

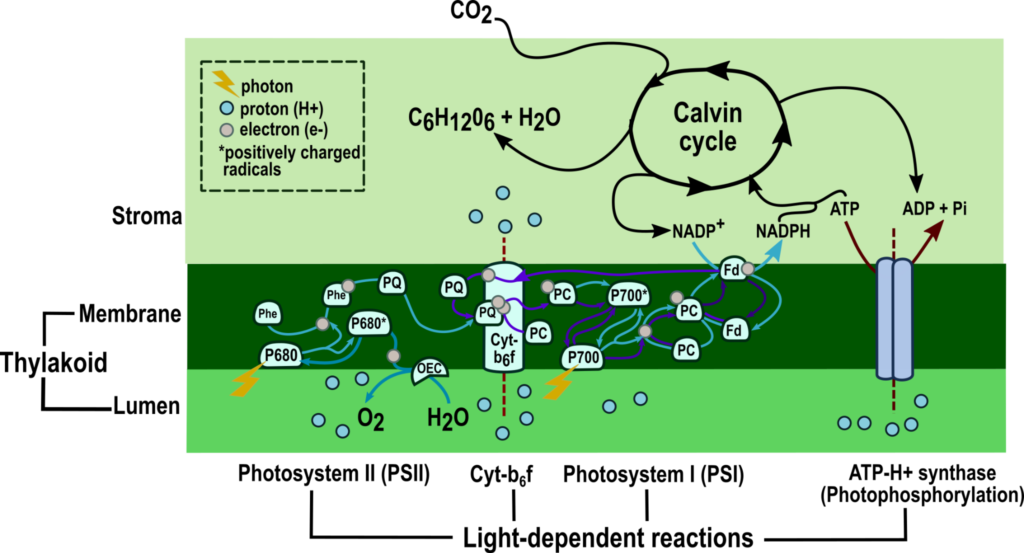
Figure 2: Mechanism of photosynthesis — Summary of its two stages: light-dependent reactions and Calvin cycle. The first stage consists of light harvesting, electron transfer and photophosphorylation. Photons are harvested from light by photoreceptors in the photosystems I and II, triggering the transfer of electrons between the two photosystems and the protein complex, cytochrome b6f. Electron transfer generates proton gradients, which drive photophosphorylation, as depicted by dark red arrows. Non-cyclic photophosphorylation, known as the Z scheme, results from the transfer of electrons shown by light-blue arrows, and cyclic photophosphorylation results from the transfer of electrons represented by purple arrows. The light reactions produce ATP and NADPH consumed in the Calvin cycle when hexose sugar (C6H12O6) is generated.

Credit: (Modified from Boyer, 2006 and Heldt, 2005).[1, 2]

A.   Light-dependent Reactions

As indicated in the name, photosynthetic light-dependent reactions occur when light is present. In eukaryotes, the light-dependent reactions take place in the thylakoid membrane in three steps (Figure 2):[1]

1.    Harvesting of Photons from Light

In this step, chlorophylls, accessory pigments, and chlorophyll-associated proteins act as photoreceptors to harvest photons from light. Photoreceptors are assembled into functional groups consisting of a photosynthetic reaction center, light-harvesting (LHC), and core antenna complexes.
 
The accessory pigments and chlorophyll-bound proteins make up the core antenna and LHC complexes. They support the photosynthetic reaction center by acting as antennae that capture photons from lights of various wavelengths. The captured photon is transferred one by one until it reaches the photosynthetic reaction center.
 
Plants, green algae, and cyanobacteria possess two photosynthetic reaction centers. They are arranged in tandem and connected via the cytochrome b6f complex.
The first photosynthetic reaction center, photosystem I (PSI), uses chlorophyll a as the primary photoreceptor. It can be excited by light at the maximum wavelength of 700 nanometers (P700).[2, 5]
 
The second reaction center, photosystem II (PSII), uses chlorophyll a and b to absorb photon energy. PSII can absorb photons from light up to the wavelength of 680 nanometers (P680).[2, 5]

2.    Electron Transfer

Harvesting photons results in photoinduced charge separation. It excites an electron of the photoreceptor to a higher energy level, forming a negatively charged radical.
 
The instability of the excited state precipitates in spontaneous electron transfer to a nearby acceptor molecule, which leaves the photoreceptor positively charged. Eventually, the photoreceptors are replenished with electrons from water or another electron transfer chain.[1-2, 5]
 
The transfer of electrons occurs in the photosystems and cytochrome b6f complex (Cyt-b6f) as follows:[1, 2, 5]
  • PSI (Plastocyanin-ferredoxin oxidoreductase)
  • PSII (Water-plastoquinine oxidoreductase)
  • Cytochrome b6f complex (Plastoquinone-plastocyanin oxidoreductase)
PSI (Plastocyanin-Ferredoxin Oxidoreductase)
When the harvested photon reaches the reaction center (P700), the excited electron is transferred to plastocyanin (PC).

Afterwards, the oxidized PC donates the electron to the next available acceptor. Once the electron reaches the stroma side of the thylakoid membrane, it oxidizes ferredoxin (Fd), while NADP+ in the stroma is simultaneously reduced to NADPH.

NADPH produced in PSI is subsequently used in carbohydrate synthesis. The -positively charged P700 is resupplied with electrons transferred from Cyt-b6f.

PSI (Plastocyanin-Ferredoxin Oxidoreductase)
At PSII, the harvested photon excites the P680, igniting an electron transfer. The negatively charged P680 sequentially donates electrons to pheophytin (Phe) and plastoquinone (PQ). Upon accepting electrons, PQ is reduced to plastosemiquinone (PQH) and plastoquinol (PQH2), which subsequently diffuses to Cyt-b6f.
 
The positively charged P680 is replenished with electrons from water. The water-splitting complex, also called the oxygen-evolving complex (OEC), catalyzes this reaction.
 
OEC is a metalloenzyme located on the luminal side of the thylakoid membrane. It contains manganese ions in its catalytic center and uses them as cofactors to initiate the oxidation of water. As a result, O2 is generated and released to the atmosphere, the electrons cancel the positively charged P680, and the residual protons (H+) are accumulated in the thylakoid lumen.
Cytochrome b6f complex (Plastoquinone-Plastocyanin Oxidoreductase)
Cytochrome b6f complex (Cyt-b6f) -connects the transfer of electrons between the photosystems. As a result, the flow of electrons between PSII and PSI is linear and follows the so-called Z scheme.
 
Here, plastoquinol (PQH2) carries the electrons from PSII to Cyt-b6f. PQH2 oxidation takes place sequentially, and electrons are eventually transferred to plastocyanin (PC). The resulting PQ refills the PSII, while the reduced PC carries the electron to replenish the positively charged PS700 in the PSI.
 
Since PQH2 is generated in the stroma-facing side of the thylakoid in PSII, PQ oxidation in Cyt-b6f  involves the transfer of electrons to the luminal side of the thylakoid membrane. Thus, electron transfer in Cyt-b6f  is coupled with proton transfer across the thylakoid membrane. This leads to the generation of proton gradients, which provide energy for photophosphorylation.

3.    Photophosphorylation[1, 2]

Z scheme pathway (non-cyclic photophosphorylation)
The transfer of electrons after light-harvesting generates a proton gradient across the thylakoid membrane.
 
Protons are deposited in the thylakoid lumen in the Z scheme during water and plastoquinol (PQH2) oxidation reactions. The accumulated protons generate the electrochemical potential that drives ATP synthesis by ADP phosphorylation via ATP-H+ synthase.
 
Thus, the Z scheme can be summarized as:
nH2O + nNADP+ + (n+⅟n)ADP + (n+⅟n)Pi —> n2O2 + nNADPH + (n+⅟n)ATP;

where n represents the number of molecules.

Cyclic photophosphorylation
Alternative to the Z scheme, ATP can be synthesized without reducing NADP+ in cyclic electron flow.
 
Here, the electron flow is restricted between PSI and Cyt-b6f. The excited electron in the P700 is transferred to PC and ferredoxin (Fd). However, the oxidized Fd does not donate electrons to NADP+. Instead, oxidized Fd is directed to Cyt-b6f, where the electrons are donated to plastoquinol and plastocyanin, respectively, while the reduced PC donates its electron to recharge the PS700.
 
Like the Z scheme, electron flow in Cyt-b6f  is coupled with proton transfer, generating the proton gradient across the thylakoid membrane that drives the conversion of ADP to ATP.

B.   The Calvin(-Benson-Bassham) Cycle

The second stage of photosynthesis requires NADPH and ATP from the light-dependent reactions for several reactions in the Calvin cycle.
 
The Calvin cycle is the reductive pentose phosphate pathway based on the reaction nature and the reactant (pentose). The reactions in the cycle occur in the stroma without the direct involvement of light. Hence, the nickname dark reactions.
 
The cycle consists of the following stages:[2]

1.    Carbon Dioxide Assimilation

Atmospheric CO2 is fixed and incorporated into ribulose-1,5-bisphosphate (RuBP), a five-carbon sugar molecule. The incorporation results in the formation of two 3-phosphoglycerate molecules.
 
The assimilation of CO2 to RuBP is highly exergonic, suggesting that it is nearly irreversible. The reaction is catalyzed by the enzyme ribulose-1,5-bisphosphate carboxylase/oxygenase (RubisCO). RubisCO is the only enzyme known to date that is capable of fixing CO2 from the atmosphere. It is also the most abundant enzyme in plants and one of the largest.[2]

2.    Reductive Pentose Synthesis

The two molecules of 3-phosphoglycerate generated from CO2 assimilation undergo successive reductive reactions, transforming them into a three-carbon glyceraldehyde-3-phosphate (G3P) and its isomer, dihydroxyacetone phosphate (DHAP). These reactions consume the ATP and NADPH generated in the light reactions.[1-2]
 
At this point, one-sixth of G3P and DHAP molecules are condensed to form a six-carbon phosphate sugar molecule, fructose-1,6-bisphosphate (FbisP). Later, FbisP is irreversibly hydrolyzed into fructose-6-phosphate, serving as a reactant in starch and cellulose biosynthesis or converted to glucose.[1] The majority of G3P and DHAP are used to regenerate RuBP.[3]

3.    Regeneration of Carbon Acceptor Molecules

In the last stage, two DHAP and three G3P molecules go through a series of enzymatic reactions to regenerate three pentose phosphate molecules.
 
Each pentose phosphate contains five carbon molecules and a phosphate group. ATP phosphorylates all three pentose phosphates to become RuBP for the next round of the Calvin cycle.
 
The reactions in the Calvin cycle can be summarized as follows:[1]
6CO2 + 12NADPH + 12H+ + 18ATP + 12H2O —-> C6H12On + 12NADP+ + 18ADP + 18Pi
 
Based on the summary, it can be roughly estimated that the fixation of one CO2 molecule consumes two NADPH molecules and three ATP molecules.

Photorespiration is the Calvin Cycle Bad Company

RubisCO possesses both carboxylase and oxygenase activities. For this reason, the enzyme can fix O2 and incorporate it into RuBP. Consequently, a two-carbon compound, phosphoglycolate and three-carbon compound, 3-phosphoglycerate (3PGA), are generated instead of two 3-phosphoglycerate molecules.
 
The generated 3PGA can enter the Calvin cycle and synthesise hexose sugar, while the two-carbon metabolite is first transported to peroxisomes for modification. The modified metabolite is transported to mitochondria and decarboxylated, releasing one molecule of CO2. Then, the metabolite is transported back to the peroxisome and converted into glycerate, which can be converted into 3PGA that can enter the Calvin cycle.[2]
 
The conversion of phosphoglycolate into 3PGA is regarded as a wasteful process. Not only CO2 is lost, but ATP and NADPH are also consumed in the process. Nevertheless, it is thought that photorespiration could prevent photodamage by consuming surplus ATP and NADPH.[2]
 
To circumvent photorespiration, alternative CO2 assimilation methods have evolved to reduce RubisCO activity. For instance, C4 and CAM plants use the enzyme phosphoenolpyruvate carboxylase, or PEP carboxylase, to capture CO2 in specialized cells.[1]

Factors Influencing Photosynthesis

The rate of photosynthesis depends on the efficiency and the effectiveness of its two stages. Based on its mechanisms, several environmental and internal factors influence the two stages of photosynthesis, including:

1.   Light Quality and Quantity

Light can initiate photosynthesis only when photoreceptors are excited by the photons.  Since photoreceptors only perceive light of limited ranges, not all light will contribute to photosynthesis, and the capacity to initiate photosynthesis is also different for each wavelength.
 
In addition, photoreceptors are proteins that can withstand only a certain level of energy before they are permanently denatured. For example, a slight increase in the light intensity, i.e. the number of photons, could enhance the rate of photosynthesis.
 
However, a significant increase in light intensity can cause photodamage that destroys photoreceptors and other photosynthetic machinery. Excess photons can also trigger photoinhibition, causing disruptions in the transfer of electrons at PSII.

2.   Water Availability

Water is a prerequisite for the light-dependent reactions and Calvin cycle. Thus, a decrease in water will affect the production of ATP and NADPH in the light-dependent reactions and synthesis of hexose sugar in the Calvin cycle.
 
Water deficiency could delay or disrupt the electron flow in the PSII because water serves as electron acceptors that replenish the charged P680. Similarly, reactions in the Calvin cycle are also disturbed due to the decrease in the amount of water that can participate or the reduction of ATP and NADPH available from the light reactions.

3.   Carbon Dioxide Concentration

As one of the reactants of the Calvin cycle, the increase in atmospheric CO2 can accelerate the synthesis of carbohydrates and reduce photorespiration.
 
Nonetheless, CO2 is fixed at the guard cell stomata, where transpiration also takes place. In other words, CO2 fixation occurs at the expense of water availability, limiting the extent to which CO2 can stimulate the rate of photosynthesis.

4.   Temperature

Temperature can act on photosynthetic machinery such as photoreceptors and enzymes in the Calvin cycle. Their 3-dimensional structures and catalytic activities slightly differ when the temperature shifts. However, extreme changes in the temperature on either end can significantly alter both the structure and activity of photosynthetic machinery.
 
Moreover, temperature change can also affect the transpiration rate, implying a change in water availability. As previously discussed, water plays a direct role in the photosynthetic electron transfer, influencing the synthesis of ATP, NADPH and carbohydrates.

5.   Genetic Predisposition

Apart from environmental factors, the efficiency of photosynthesis also depends on the internal factors of the organisms of interest. These factors are genetic predispositions, which dictate the working of the biological systems.
 
For example, genetic variations in the photoreceptors and related enzymes can be translated into differences in their functions and catalytic abilities. On a larger scale, some green algae and plants species have evolved new mechanisms that minimize wasteful processes and enhance the efficiency of photosynthesis.

In Conclusion

All in all, photosynthesis is a complex biochemical process that captures solar energy for food production. The two stages of photosynthesis include the light-dependent reactions where photoreceptors harvest photons, triggering a series of electron transport. The first stage releases oxygen to the atmosphere and generates ATP and NADPH for the second stage.
 
Carbohydrates and other macromolecules are synthesized from ATP and NADPH-consuming reactions in the Calvin cycle (second stage). These macromolecules not only feed the autotrophs but are also consumed and used by other organisms in the ecosystem.
 
Thus, photosynthesis is a process that provides the organisms in the ecosystem with the air to breathe, food to eat, and raw materials for manufacturing non-food products.

References:

  1. Boyer R, Concepts in Biochemistry, 3rd edition. New Jersey: John Wiley & Sons; 2006.
  2. Heldt H-Wa. Plant Biochemistry. 3rd ed. San Diago, California: Academic Press; 2005.
  3. Martin WF, Garg S, Zimorski V. Endosymbiotic theories for eukaryote origin. Philos Trans R Soc B Biol Sci. 2015;370(1678):20140330. doi:10.1098/rstb.2014.0330
  4. Milne BF, Toker Y, Rubio A, Nielsen SB. Unraveling the Intrinsic Color of Chlorophyll. Angew Chemie Int Ed. 2015;54(7):2170-2173. doi:10.1002/anie.201410899
  5. Gao J, Wang H, Yuan Q, Feng Y. Structure and Function of the Photosystem Supercomplexes. Front Plant Sci. 2018;9. doi:10.3389/fpls.2018.00357

Learn More about our Services and how can we help you with your research!

Introduction

In behavioral neuroscience, the Open Field Test (OFT) remains one of the most widely used assays to evaluate rodent models of affect, cognition, and motivation. It provides a non-invasive framework for examining how animals respond to novelty, stress, and pharmacological or environmental manipulations. Among the test’s core metrics, the percentage of time spent in the center zone offers a uniquely normalized and sensitive measure of an animal’s emotional reactivity and willingness to engage with a potentially risky environment.

This metric is calculated as the proportion of time spent in the central area of the arena—typically the inner 25%—relative to the entire session duration. By normalizing this value, researchers gain a behaviorally informative variable that is resilient to fluctuations in session length or overall movement levels. This makes it especially valuable in comparative analyses, longitudinal monitoring, and cross-model validation.

Unlike raw center duration, which can be affected by trial design inconsistencies, the percentage-based measure enables clearer comparisons across animals, treatments, and conditions. It plays a key role in identifying trait anxiety, avoidance behavior, risk-taking tendencies, and environmental adaptation, making it indispensable in both basic and translational research contexts.

Whereas simple center duration provides absolute time, the percentage-based metric introduces greater interpretability and reproducibility, especially when comparing different animal models, treatment conditions, or experimental setups. It is particularly effective for quantifying avoidance behaviors, risk assessment strategies, and trait anxiety profiles in both acute and longitudinal designs.

What Does Percentage of Time in the Centre Measure?

This metric reflects the relative amount of time an animal chooses to spend in the open, exposed portion of the arena—typically defined as the inner 25% of a square or circular enclosure. Because rodents innately prefer the periphery (thigmotaxis), time in the center is inversely associated with anxiety-like behavior. As such, this percentage is considered a sensitive, normalized index of:

  • Exploratory drive vs. risk aversion: High center time reflects an animal’s willingness to engage with uncertain or exposed environments, often indicative of lower anxiety and a stronger intrinsic drive to explore. These animals are more likely to exhibit flexible, information-gathering behaviors. On the other hand, animals that spend little time in the center display a strong bias toward the safety of the perimeter, indicative of a defensive behavioral state or trait-level risk aversion. This dichotomy helps distinguish adaptive exploration from fear-driven avoidance.

  • Emotional reactivity: Fluctuations in center time percentage serve as a sensitive behavioral proxy for changes in emotional state. In stress-prone or trauma-exposed animals, decreased center engagement may reflect hypervigilance or fear generalization, while a sudden increase might indicate emotional blunting or impaired threat appraisal. The metric is also responsive to acute stressors, environmental perturbations, or pharmacological interventions that impact affective regulation.

  • Behavioral confidence and adaptation: Repeated exposure to the same environment typically leads to reduced novelty-induced anxiety and increased behavioral flexibility. A rising trend in center time percentage across trials suggests successful habituation, reduced threat perception, and greater confidence in navigating open spaces. Conversely, a stable or declining trend may indicate behavioral rigidity or chronic stress effects.

  • Pharmacological or genetic modulation: The percentage of time in the center is widely used to evaluate the effects of pharmacological treatments and genetic modifications that influence anxiety-related circuits. Anxiolytic agents—including benzodiazepines, SSRIs, and cannabinoid agonists—reliably increase center occupancy, providing a robust behavioral endpoint in preclinical drug trials. Similarly, genetic models targeting serotonin receptors, GABAergic tone, or HPA axis function often show distinct patterns of center preference, offering translational insights into psychiatric vulnerability and resilience.

Critically, because this metric is normalized by session duration, it accommodates variability in activity levels or testing conditions. This makes it especially suitable for comparing across individuals, treatment groups, or timepoints in longitudinal studies.

A high percentage of center time indicates reduced anxiety, increased novelty-seeking, or pharmacological modulation (e.g., anxiolysis). Conversely, a low percentage suggests emotional inhibition, behavioral avoidance, or contextual hypervigilance. reduced anxiety, increased novelty-seeking, or pharmacological modulation (e.g., anxiolysis). Conversely, a low percentage suggests emotional inhibition, behavioral avoidance, or contextual hypervigilance.

Behavioral Significance and Neuroscientific Context

1. Emotional State and Trait Anxiety

The percentage of center time is one of the most direct, unconditioned readouts of anxiety-like behavior in rodents. It is frequently reduced in models of PTSD, chronic stress, or early-life adversity, where animals exhibit persistent avoidance of the center due to heightened emotional reactivity. This metric can also distinguish between acute anxiety responses and enduring trait anxiety, especially in longitudinal or developmental studies. Its normalized nature makes it ideal for comparing across cohorts with variable locomotor profiles, helping researchers detect true affective changes rather than activity-based confounds.

2. Exploration Strategies and Cognitive Engagement

Rodents that spend more time in the center zone typically exhibit broader and more flexible exploration strategies. This behavior reflects not only reduced anxiety but also cognitive engagement and environmental curiosity. High center percentage is associated with robust spatial learning, attentional scanning, and memory encoding functions, supported by coordinated activation in the prefrontal cortex, hippocampus, and basal forebrain. In contrast, reduced center engagement may signal spatial rigidity, attentional narrowing, or cognitive withdrawal, particularly in models of neurodegeneration or aging.

3. Pharmacological Responsiveness

The open field test remains one of the most widely accepted platforms for testing anxiolytic and psychotropic drugs. The percentage of center time reliably increases following administration of anxiolytic agents such as benzodiazepines, SSRIs, and GABA-A receptor agonists. This metric serves as a sensitive and reproducible endpoint in preclinical dose-finding studies, mechanistic pharmacology, and compound screening pipelines. It also aids in differentiating true anxiolytic effects from sedation or motor suppression by integrating with other behavioral parameters like distance traveled and entry count (Prut & Belzung, 2003).

4. Sex Differences and Hormonal Modulation

Sex-based differences in emotional regulation often manifest in open field behavior, with female rodents generally exhibiting higher variability in center zone metrics due to hormonal cycling. For example, estrogen has been shown to facilitate exploratory behavior and increase center occupancy, while progesterone and stress-induced corticosterone often reduce it. Studies involving gonadectomy, hormone replacement, or sex-specific genetic knockouts use this metric to quantify the impact of endocrine factors on anxiety and exploratory behavior. As such, it remains a vital tool for dissecting sex-dependent neurobehavioral dynamics.
The percentage of center time is one of the most direct, unconditioned readouts of anxiety-like behavior in rodents. It is frequently reduced in models of PTSD, chronic stress, or early-life adversity. Because it is normalized, this metric is especially helpful for distinguishing between genuine avoidance and low general activity.

Methodological Considerations

  • Zone Definition: Accurately defining the center zone is critical for reliable and reproducible data. In most open field arenas, the center zone constitutes approximately 25% of the total area, centrally located and evenly distanced from the walls. Software-based segmentation tools enhance precision and ensure consistency across trials and experiments. Deviations in zone parameters—whether due to arena geometry or tracking inconsistencies—can result in skewed data, especially when calculating percentages.


  • Trial Duration: Trials typically last between 5 to 10 minutes. The percentage of time in the center must be normalized to total trial duration to maintain comparability across animals and experimental groups. Longer trials may lead to fatigue, boredom, or habituation effects that artificially reduce exploratory behavior, while overly short trials may not capture full behavioral repertoires or response to novel stimuli.


  • Handling and Habituation: Variability in pre-test handling can introduce confounds, particularly through stress-induced hypoactivity or hyperactivity. Standardized handling routines—including gentle, consistent human interaction in the days leading up to testing—reduce variability. Habituation to the testing room and apparatus prior to data collection helps animals engage in more representative exploratory behavior, minimizing novelty-induced freezing or erratic movement.


  • Tracking Accuracy: High-resolution tracking systems should be validated for accurate, real-time detection of full-body center entries and sustained occupancy. The system should distinguish between full zone occupancy and transient overlaps or partial body entries that do not reflect true exploratory behavior. Poor tracking fidelity or lag can produce significant measurement error in percentage calculations.


  • Environmental Control: Uniformity in environmental conditions is essential. Lighting should be evenly diffused to avoid shadow bias, and noise should be minimized to prevent stress-induced variability. The arena must be cleaned between trials using odor-neutral solutions to eliminate scent trails or pheromone cues that may affect zone preference. Any variation in these conditions can introduce systematic bias in center zone behavior. Use consistent definitions of the center zone (commonly 25% of total area) to allow valid comparisons. Software-based segmentation enhances spatial precision.

Interpretation with Complementary Metrics

Temporal Dynamics of Center Occupancy

Evaluating how center time evolves across the duration of a session—divided into early, middle, and late thirds—provides insight into behavioral transitions and adaptive responses. Animals may begin by avoiding the center, only to gradually increase center time as they habituate to the environment. Conversely, persistently low center time across the session can signal prolonged anxiety, fear generalization, or a trait-like avoidance phenotype.

Cross-Paradigm Correlation

To validate the significance of center time percentage, it should be examined alongside results from other anxiety-related tests such as the Elevated Plus Maze, Light-Dark Box, or Novelty Suppressed Feeding. Concordance across paradigms supports the reliability of center time as a trait marker, while discordance may indicate task-specific reactivity or behavioral dissociation.

Behavioral Microstructure Analysis

When paired with high-resolution scoring of behavioral events such as rearing, grooming, defecation, or immobility, center time offers a richer view of the animal’s internal state. For example, an animal that spends substantial time in the center while grooming may be coping with mild stress, while another that remains immobile in the periphery may be experiencing more severe anxiety. Microstructure analysis aids in decoding the complexity behind spatial behavior.

Inter-individual Variability and Subgroup Classification

Animals naturally vary in their exploratory style. By analyzing percentage of center time across subjects, researchers can identify behavioral subgroups—such as consistently bold individuals who frequently explore the center versus cautious animals that remain along the periphery. These classifications can be used to examine predictors of drug response, resilience to stress, or vulnerability to neuropsychiatric disorders.

Machine Learning-Based Behavioral Clustering

In studies with large cohorts or multiple behavioral variables, machine learning techniques such as hierarchical clustering or principal component analysis can incorporate center time percentage to discover novel phenotypic groupings. These data-driven approaches help uncover latent dimensions of behavior that may not be visible through univariate analyses alone.

Total Distance Traveled

Total locomotion helps contextualize center time. Low percentage values in animals with minimal movement may reflect sedation or fatigue, while similar values in high-mobility subjects suggest deliberate avoidance. This metric helps distinguish emotional versus motor causes of low center engagement.

Number of Center Entries

This measure indicates how often the animal initiates exploration of the center zone. When combined with percentage of time, it differentiates between frequent but brief visits (indicative of anxiety or impulsivity) versus fewer but sustained center engagements (suggesting comfort and behavioral confidence).

Latency to First Center Entry

The delay before the first center entry reflects initial threat appraisal. Longer latencies may be associated with heightened fear or low motivation, while shorter latencies are typically linked to exploratory drive or low anxiety.

Thigmotaxis Time

Time spent hugging the walls offers a spatial counterbalance to center metrics. High thigmotaxis and low center time jointly support an interpretation of strong avoidance behavior. This inverse relationship helps triangulate affective and motivational states.

Applications in Translational Research

  • Drug Discovery: The percentage of center time is a key behavioral endpoint in the development and screening of anxiolytic, antidepressant, and antipsychotic medications. Its sensitivity to pharmacological modulation makes it particularly valuable in dose-response assessments and in distinguishing therapeutic effects from sedative or locomotor confounds. Repeated trials can also help assess drug tolerance and chronic efficacy over time.
  • Genetic and Neurodevelopmental Modeling: In transgenic and knockout models, altered center percentage provides a behavioral signature of neurodevelopmental abnormalities. This is particularly relevant in the study of autism spectrum disorders, ADHD, fragile X syndrome, and schizophrenia, where subjects often exhibit heightened anxiety, reduced flexibility, or altered environmental engagement.
  • Hormonal and Sex-Based Research: The metric is highly responsive to hormonal fluctuations, including estrous cycle phases, gonadectomy, and hormone replacement therapies. It supports investigations into sex differences in stress reactivity and the behavioral consequences of endocrine disorders or interventions.
  • Environmental Enrichment and Deprivation: Housing conditions significantly influence anxiety-like behavior and exploratory motivation. Animals raised in enriched environments typically show increased center time, indicative of reduced stress and greater behavioral plasticity. Conversely, socially isolated or stimulus-deprived animals often show strong center avoidance.
  • Behavioral Biomarker Development: As a robust and reproducible readout, center time percentage can serve as a behavioral biomarker in longitudinal and interventional studies. It is increasingly used to identify early signs of affective dysregulation or to track the efficacy of neuromodulatory treatments such as optogenetics, chemogenetics, or deep brain stimulation.
  • Personalized Preclinical Models: This measure supports behavioral stratification, allowing researchers to identify high-anxiety or low-anxiety phenotypes before treatment. This enables within-group comparisons and enhances statistical power by accounting for pre-existing behavioral variation. Used to screen anxiolytic agents and distinguish between compounds with sedative vs. anxiolytic profiles.

Enhancing Research Outcomes with Percentage-Based Analysis

By expressing center zone activity as a proportion of total trial time, researchers gain a metric that is resistant to session variability and more readily comparable across time, treatment, and model conditions. This normalized measure enhances reproducibility and statistical power, particularly in multi-cohort or cross-laboratory designs.

For experimental designs aimed at assessing anxiety, exploratory strategy, or affective state, the percentage of time spent in the center offers one of the most robust and interpretable measures available in the Open Field Test.

Explore high-resolution tracking solutions and open field platforms at

References

  • Prut, L., & Belzung, C. (2003). The open field as a paradigm to measure the effects of drugs on anxiety-like behaviors: a review. European Journal of Pharmacology, 463(1–3), 3–33.
  • Seibenhener, M. L., & Wooten, M. C. (2015). Use of the open field maze to measure locomotor and anxiety-like behavior in mice. Journal of Visualized Experiments, (96), e52434.
  • Crawley, J. N. (2007). What’s Wrong With My Mouse? Behavioral Phenotyping of Transgenic and Knockout Mice. Wiley-Liss.
  • Carola, V., D’Olimpio, F., Brunamonti, E., Mangia, F., & Renzi, P. (2002). Evaluation of the elevated plus-maze and open-field tests for the assessment of anxiety-related behavior in inbred mice. Behavioral Brain Research, 134(1–2), 49–57.

Written by researchers, for researchers — powered by Conduct Science.