

Nucleic acids are an essential class of macromolecules present in all cells of organisms including viruses.[1] They were first discovered by Friedrich Mischer in 1869. He wanted to study the composition of leukocytes from the pus cells of discarded surgical bandages. During his study, he observed nucleic acids in the form of a precipitate when the cells were treated with acid. He called this component nuclein. Later in 1889, Altmann named the constituent nucleic acid.[2]
A few other major historical events in the discovery of nucleic acids are mentioned below:[2]
Nucleic acids act as a blueprint of all the information to build and develop organisms. They are the chemical basis for the transmission of genetic information or traits from parents to offspring.
This article describes the structure, biochemical properties, and functions of nucleic acids in organisms.
Nucleic acids are biopolymers built from several monomer units of nucleotides that are composed of three components: sugar, phosphate, and a nitrogenous base.
Nitrogenous bases are planar, heterocyclic, and water-soluble molecules. They are of two types: purines and pyrimidines.[5]
Purines: Purines are two carbon-nitrogen rings. It includes adenine (6-aminopurine) and guanine (6-oxy-2-aminopurine). Adenine contains an amino group at the C-6 position of the ring while guanine has an amino group at the C-2 position and a carbonyl group at the C-6 position.[5]
Pyrimidines: The primary structure of pyrimidines is composed of a single carbon-nitrogen ring. Thymine (5-methyl-2,4-dioxypyrimidine) and cytosine (2-oxo-4-aminopyrimidine) are two pyrimidines found in DNA, while uracil (2,4-dioxypyrimidine) and cytosine are found in RNA.[5]
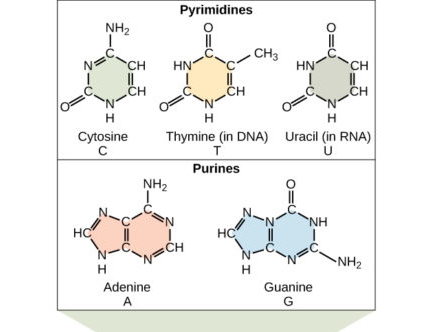
Image: The structural diagram of two purines and three pyrimidines found in DNA and RNA.[6]
Source: lumenlearning
Two types of sugar occur in nucleic acids: Ribose and deoxyribose sugar. The difference between these two types of sugars is due to the presence of the hydroxyl group on the second carbon of the ribose, and hydrogen on the second carbon of the deoxyribose. All the sugars present in nucleic acids exist in D-stereoisomeric forms.[5]
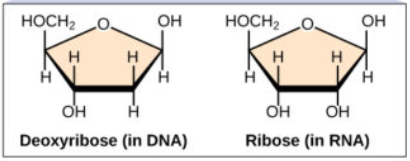
Image: The structural configuration of deoxyribose and ribose sugar.[6]
Source: Lumenlearning
The pentose sugar present in nucleic acids is planar and puckered around C2’ or C3’ carbon. Purines are in C2’- endo pucker conformation while pyrimidines prefer C3’- endo conformation.[5]
Nucleic acids are divided into two main classes, based on the sugar involved in the formation of nucleic acid structure: Deoxyribonucleic Acid (DNA) and Ribonucleic Acid (RNA).
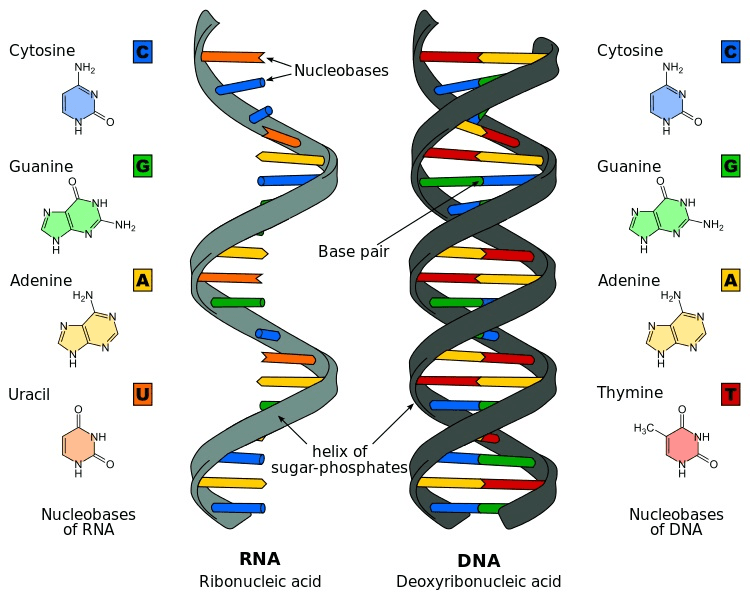
Image: The structure of DNA and RNA with the representation of their nitrogenous bases and helix formation.[7]
Source: Biologydictionary
The phosphate group present in the nucleotides distinguishes them from nucleosides (composed of only sugar and nitrogenous base and have entirely different functions). Nucleic acids are formed from the joining of two or more nucleotides.
The condensation reaction occurs between the alcohol of a 5’- phosphate group of one nucleotide and the 3’- hydroxyl group of a second nucleotide. The reaction leads to the formation of phosphodiester bonds between the molecules.[5]
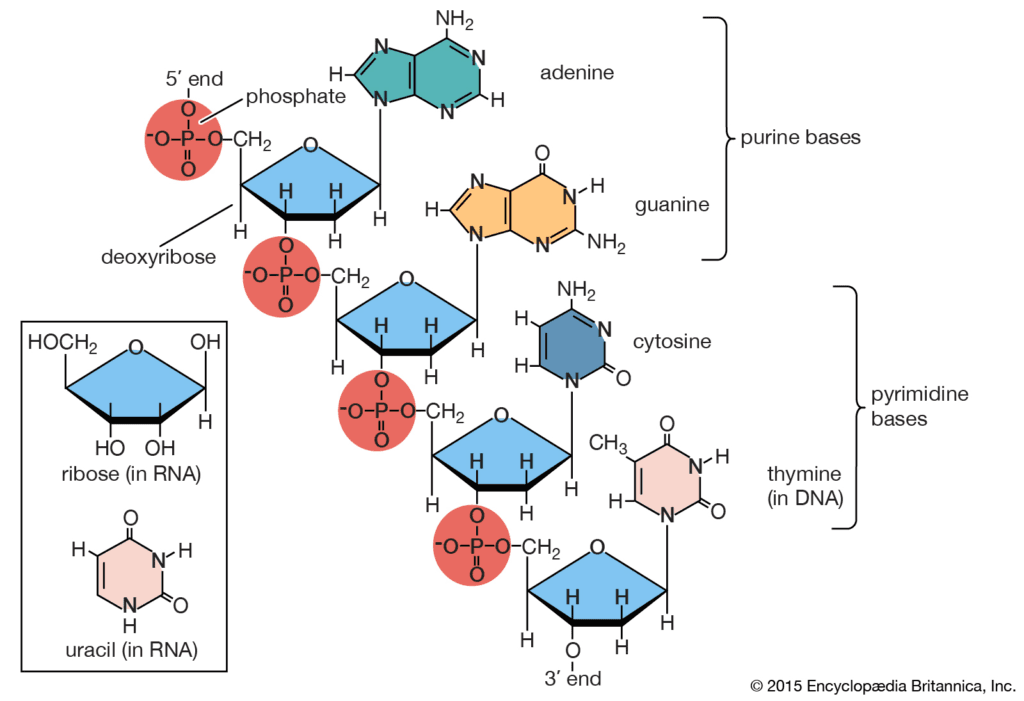
Image: A representative complete structure of nucleic acids.[8]
Source: Encyclopedia Britannica
In 1962, Watson, Crick, and Wilkins were awarded the Nobel prize for discovering the double-helix molecular structure of DNA. The four bases present in DNA structure include adenine (A), guanine (G), cytosine (C), and thymine (T).
The structure proposed by Watson and Crick is the B-form of the DNA double helix. However, DNA also exists in two other forms — A-form and Z-form — that are also biologically significant structural forms. The conformation adopted by DNA, out of these three forms, depends on the hydration level, DNA sequence, chemical modification of the bases, and the concentration of metal ions in solutions.[5]
The nitrogenous bases constituting DNA always form a pair by establishing hydrogen bonds between them. For example, adenine and thymine bond together with two hydrogen bonds, while guanine and cytosine bond together with three hydrogen bonds between them.[8] The bonding has a significant biological role in the replication mechanism of DNA and the transfer of genetic information.[8]
The bases act as a bridge between two sugar-phosphate chains of the DNA. Sugar and phosphate are the backbones of the DNA strands.
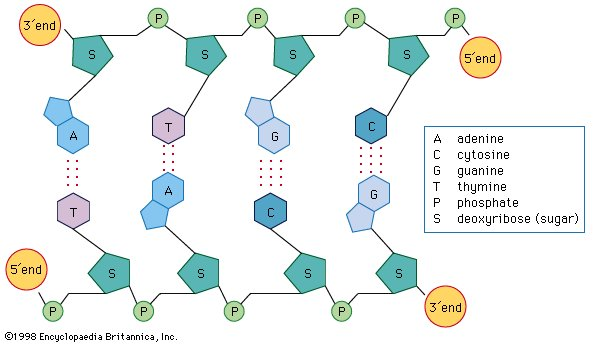
Image: A schematic representation of hydrogen bonds between the nitrogenous bases, linking together two strands of the DNA.
Source: Encyclopedia Britannica[8]
Some of the major features of B-DNA are given below:[5]
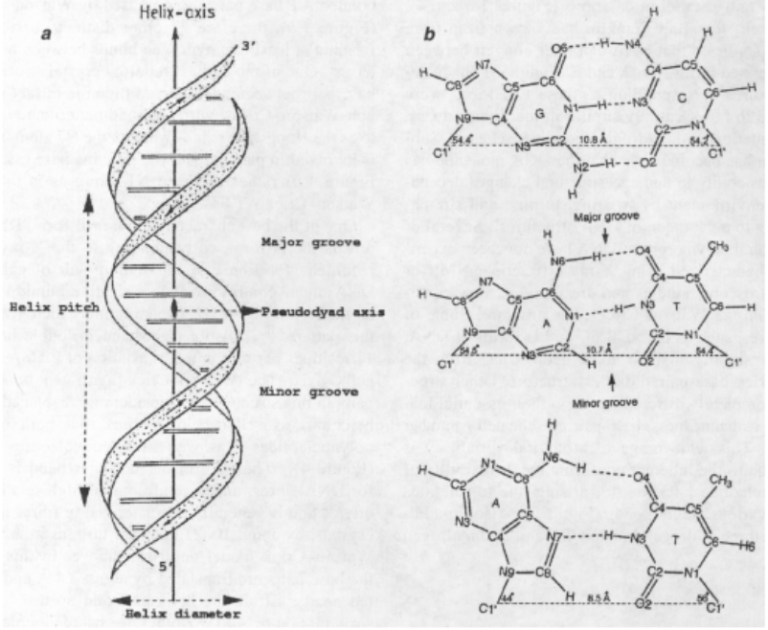
Image: The schematic diagram of Watson-Crick double-helical B-DNA.[9]
Source: Bansal, M. (2003). DNA structure: Revisiting the Watson–Crick double helix.
Given below is a chart of features and differences between B-, A-, and Z-forms of the DNA structure:[5]
| S/N | Features | A-form | B-form | Z-form |
|---|---|---|---|---|
|
1 |
Helix sense |
Right-handed |
Right-handed |
Left-handed |
|
2 |
Repeating units |
1 bp |
1 bp |
2 bp |
|
3 |
Twist angle |
33.6° |
34.3° |
60°/2 |
|
4 |
Mean bp/turn |
10.7 |
10.4 |
12 |
|
5 |
Base pair tilt |
20° |
-6° |
7° |
|
6 |
Rise/base pair |
2.3 Å |
3.32 Å |
3.8 Å |
|
7 |
Pitch/helix turn |
24.6 Å |
33.2 Å |
45.6 Å |
|
8 |
Mean propeller twist |
+18° |
+16° |
0° |
|
9 |
Glycosidic bond |
Anti |
Anti |
Anti for C, syn for G |
|
10 |
Sugar pucker |
C3’-endo |
C2’-endo |
C-C2’-endo, G-C3’ endo |
|
11 |
Diameter |
23 Å |
20 Å |
18 Å |
|
12 |
Major groove |
Narrow and deep |
Wide and deep |
Flat |
|
13 |
Minor groove |
Wide and Shallow |
Narrow and deep |
Narrow and deep |
DNA double helix, when exposed to specific conditions of pH, ionic strength, or temperature, disrupts the hydrogen bond connecting the two strands of DNA. When the temperature is the denaturing agent, the process is known as the melting of DNA.[5]
Denaturation changes the physical properties of DNA and increases the absorbance of the DNA solution by 40% at 260 nm (termed as hyperchromic shift). The temperature at which the change in absorbance is half-maximal, or at the midpoint, is known as melting temperature (Tm).[5]
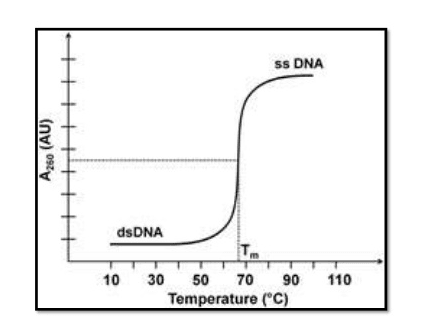
Image: The graph for thermal denaturation of dsDNA to ssDNA.[10]
Source: Slideshare
The denatured DNA strands can be re-natured by the method of slow cooling, but the graph will not be similar to denatured DNA.
The melting temperature of dsDNA depends on several factors including GC (guanine and cytosine) content of DNA, ionic strength, and change in pH.
The DNA helix is stabilized by noncovalent interactions which include stacking interaction between adjacent bases and hydrogen bonds between adjacent strands. The stacking interaction between bases involves hydrophobic interaction and Van der Waals interaction that provides overall stability and minimizes contact of the bases with water.[5]
The hydrogen bond is present between the nitrogenous bases (connecting two strands) and in the sugar-phosphate backbone (connecting with water molecules). A sum of all these interactions provides overall strong stability to the DNA helix.
DNA can be modified by enzymes like DNA methyltransferase, physical agents like oxidants or ionizing radiation, or chemical carcinogens.[8] It can also be cleaved and degraded by enzymes like endonucleases or exonucleases. The abnormal modifications in the DNA by any of the mentioned agents lead to severe fatal diseases in the organisms.[8]
Supercoiling is referred to as the coiling of a DNA double helix upon itself. It represents the structural strain in the DNA structure. If a B-DNA contains 10.4 base pairs per turn, it’s referred to as being in a relaxed state. However, if the DNA structure has base pairs less or more than 10.4 per turn, it’s considered to be supercoiled — a situation created due to torsional stress in the helix.[5]
The supercoiling can be positive (overwound, having fewer base pairs per turn than relaxed DNA) or negative (under wounded, having more base pairs per turn than relaxed DNA).
Supercoiling occurs in circular DNA or plasmid due to cleavage and resealing of DNA molecules. It is measured by the linking number, which is the number of times one strand crosses over the other.[5]
The formula to calculate the linking number of the closed supercoiled DNA is: Lk = Tw + Wr, where Tw represents twist, that is the total number of helical turns in DNA and Wr represents wreath number, which refers to the supercoiling of helix in space.[5]
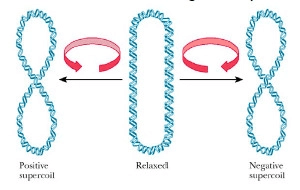
Image: A schematic diagram of supercoiling of the DNA.[11]
Source: Quizlet
RNA is a nucleotide polymer consisting of four bases — adenine (A), guanine (G), cytosine (C), and uracil (U) — sugar, and phosphate. The information contained by DNA is transferred to the whole body at specific locations through RNA. They are involved in several essential metabolic functions required for living organisms.
RNA is a single-strand helical structure. The phosphate group present in the structure makes it a charged molecule (polyanion). A distinguishing feature in the RNA structure is the presence of hydroxyl group at the 2’ position of the ribose sugar, which gives it an A-form geometrical structure.[5]
RNA structures have the capability of self-folding, that is, interchain complementary base pairing between the bases of the strand. It leads to the formation of bulges and helices in the RNA strands. In perchlorate solution, a hybrid structure of RNA/DNA form is more stable than either RNA/RNA or DNA/DNA duplexes.[5]
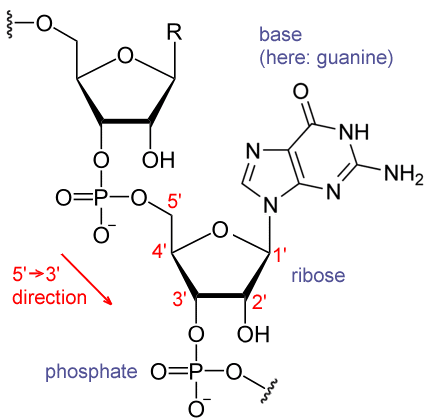
Image: A fragment of an RNA structure, showing a guanosyl subunit.[12]
Source: Wikipedia
RNA molecules can be found in multiple copies and several forms inside the cells. A few major classes of RNA include mRNA, rRNA, tRNA, snRNA, snoRNA, miRNA, XIST, siRNA, tmRNA, and telomerase RNA.[5] Out of all these RNAs, the most well-known and well-studied RNA molecules are: mRNA, rRNA, and tRNA.
They play diverse roles in organisms including transfer of genetic information during protein synthesis, gene expression, enzymatic activity, and storage of genetic information in RNA viruses and viroids.[5]
mRNA refers to messenger RNA. It copies and carries the information, encoded in one or more genes, from the DNA to ribosome for protein formation. Some differences between the RNA molecules of eukaryotes and prokaryotes are mentioned below:[13]
| S/N | Eukaryotic mRNA | Prokaryotic mRNA |
|---|---|---|
|
1 |
Mostly monocistronic mRNA (encodes only a single protein) with an average size of 1500-2000 nucleotides. |
Polycistronic mRNA that encodes several proteins. |
|
2 |
It has a cap-like structure at the 5’-end. |
It doesn’t have any cap-like structure at the 5’-end. |
|
3 |
It has a long poly-A tail at the 3’ end that helps to stabilize RNA. |
It has a short poly-A tail at the 3’-end that acts as a targeting signal for RNA destruction. |
|
4 |
It doesn’t have intercistronic regions. |
It has intercistronic regions. |
|
5 |
It requires extensive processing and transport. |
It doesn’t require any processing. |
rRNA molecules are ribosomal RNA. These are the most abundant forms of RNA in a cell, forming 80% of the RNA molecules in eukaryotes.[13] It associates with ribosomes to form a complex structure that moves in a 5’ to 3’ direction to catalyze the formation of proteins. These molecules play an active role in recognizing the conserved positions of mRNA and tRNA.[13]
In eukaryotes, the four different rRNA molecules include 18s, 5.8s, 28s, and 5s rRNA, whereas, in prokaryotes, it includes 16s, 5s, and 23s rRNA. [13]
tRNA is referred to as transfer RNA or adaptor RNA. It carries individual amino acids into the ribosomes to assemble the growing polypeptide chains. tRNA has clover leaf-like structures containing 70-80 nucleotides. The structure has well-defined stems and loops that make up the acceptor arm, D-stem and loop, anticodon stem and loop, and the T-stem and loop.[13]
Each amino acid has its specific type of tRNA. Each tRNA binds to the specific amino acids and carries them to the growing polypeptide chain. The prokaryotes have 30-45 different tRNA and the eukaryotes contain 50 or more tRNA.[13]
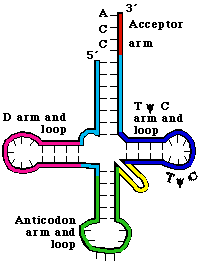
Images: The labeled clover leaf-like structure of tRNA.[14]
Source: bx.psu.edu
Eukaryotes and prokaryotes have different RNA processing mechanisms. In eukaryotes, the process of mRNA and protein synthesis occurs in different compartments of the cell. However, in prokaryotes, both events simultaneously occur in the single compartment of the cell. Because of this reason, the mRNA of prokaryotes undergo little or no modification after synthesis, whereas, pre-tRNA and pre-rRNA undergo processing like cleavage, the addition of a nucleotide, and chemical modifications after synthesis.[13]
In eukaryotes, after pre-mRNA is synthesized, it undergoes different processing stages including 5’-capping, 3’cleavage/polyadenylation, splicing, and RNA editing before they are transported to the cytoplasm for protein synthesis.[13] The rRNA and tRNA of eukaryotes undergo the same modification processes as of prokaryotes.
Nucleic acids are one of the major biomolecules required for the proper functioning of the body. These are the molecules responsible for carrying the genetic information from parents to offspring, gene expression, and synthesis of proteins required for metabolic functions.
After the discovery of nucleic acids in 1869, research on these molecules has come a long way. Several regions in the DNA have been identified to be responsible for particular traits or mutations leading to fatal diseases. The study of several other RNAs including snoRNA, XIST, and siRNA needs an in-depth understanding of their functioning in the organism’s body.
The nucleic acid study is an ongoing and popular research area in clinical studies because of its importance in the study of the mechanisms, cures, and treatments of several diseases, whose mysteries are hidden in the genetic codes of these molecules.
In behavioral neuroscience, the Open Field Test (OFT) remains one of the most widely used assays to evaluate rodent models of affect, cognition, and motivation. It provides a non-invasive framework for examining how animals respond to novelty, stress, and pharmacological or environmental manipulations. Among the test’s core metrics, the percentage of time spent in the center zone offers a uniquely normalized and sensitive measure of an animal’s emotional reactivity and willingness to engage with a potentially risky environment.
This metric is calculated as the proportion of time spent in the central area of the arena—typically the inner 25%—relative to the entire session duration. By normalizing this value, researchers gain a behaviorally informative variable that is resilient to fluctuations in session length or overall movement levels. This makes it especially valuable in comparative analyses, longitudinal monitoring, and cross-model validation.
Unlike raw center duration, which can be affected by trial design inconsistencies, the percentage-based measure enables clearer comparisons across animals, treatments, and conditions. It plays a key role in identifying trait anxiety, avoidance behavior, risk-taking tendencies, and environmental adaptation, making it indispensable in both basic and translational research contexts.
Whereas simple center duration provides absolute time, the percentage-based metric introduces greater interpretability and reproducibility, especially when comparing different animal models, treatment conditions, or experimental setups. It is particularly effective for quantifying avoidance behaviors, risk assessment strategies, and trait anxiety profiles in both acute and longitudinal designs.
This metric reflects the relative amount of time an animal chooses to spend in the open, exposed portion of the arena—typically defined as the inner 25% of a square or circular enclosure. Because rodents innately prefer the periphery (thigmotaxis), time in the center is inversely associated with anxiety-like behavior. As such, this percentage is considered a sensitive, normalized index of:
Critically, because this metric is normalized by session duration, it accommodates variability in activity levels or testing conditions. This makes it especially suitable for comparing across individuals, treatment groups, or timepoints in longitudinal studies.
A high percentage of center time indicates reduced anxiety, increased novelty-seeking, or pharmacological modulation (e.g., anxiolysis). Conversely, a low percentage suggests emotional inhibition, behavioral avoidance, or contextual hypervigilance. reduced anxiety, increased novelty-seeking, or pharmacological modulation (e.g., anxiolysis). Conversely, a low percentage suggests emotional inhibition, behavioral avoidance, or contextual hypervigilance.
The percentage of center time is one of the most direct, unconditioned readouts of anxiety-like behavior in rodents. It is frequently reduced in models of PTSD, chronic stress, or early-life adversity, where animals exhibit persistent avoidance of the center due to heightened emotional reactivity. This metric can also distinguish between acute anxiety responses and enduring trait anxiety, especially in longitudinal or developmental studies. Its normalized nature makes it ideal for comparing across cohorts with variable locomotor profiles, helping researchers detect true affective changes rather than activity-based confounds.
Rodents that spend more time in the center zone typically exhibit broader and more flexible exploration strategies. This behavior reflects not only reduced anxiety but also cognitive engagement and environmental curiosity. High center percentage is associated with robust spatial learning, attentional scanning, and memory encoding functions, supported by coordinated activation in the prefrontal cortex, hippocampus, and basal forebrain. In contrast, reduced center engagement may signal spatial rigidity, attentional narrowing, or cognitive withdrawal, particularly in models of neurodegeneration or aging.
The open field test remains one of the most widely accepted platforms for testing anxiolytic and psychotropic drugs. The percentage of center time reliably increases following administration of anxiolytic agents such as benzodiazepines, SSRIs, and GABA-A receptor agonists. This metric serves as a sensitive and reproducible endpoint in preclinical dose-finding studies, mechanistic pharmacology, and compound screening pipelines. It also aids in differentiating true anxiolytic effects from sedation or motor suppression by integrating with other behavioral parameters like distance traveled and entry count (Prut & Belzung, 2003).
Sex-based differences in emotional regulation often manifest in open field behavior, with female rodents generally exhibiting higher variability in center zone metrics due to hormonal cycling. For example, estrogen has been shown to facilitate exploratory behavior and increase center occupancy, while progesterone and stress-induced corticosterone often reduce it. Studies involving gonadectomy, hormone replacement, or sex-specific genetic knockouts use this metric to quantify the impact of endocrine factors on anxiety and exploratory behavior. As such, it remains a vital tool for dissecting sex-dependent neurobehavioral dynamics.
The percentage of center time is one of the most direct, unconditioned readouts of anxiety-like behavior in rodents. It is frequently reduced in models of PTSD, chronic stress, or early-life adversity. Because it is normalized, this metric is especially helpful for distinguishing between genuine avoidance and low general activity.
Environmental Control: Uniformity in environmental conditions is essential. Lighting should be evenly diffused to avoid shadow bias, and noise should be minimized to prevent stress-induced variability. The arena must be cleaned between trials using odor-neutral solutions to eliminate scent trails or pheromone cues that may affect zone preference. Any variation in these conditions can introduce systematic bias in center zone behavior. Use consistent definitions of the center zone (commonly 25% of total area) to allow valid comparisons. Software-based segmentation enhances spatial precision.
Evaluating how center time evolves across the duration of a session—divided into early, middle, and late thirds—provides insight into behavioral transitions and adaptive responses. Animals may begin by avoiding the center, only to gradually increase center time as they habituate to the environment. Conversely, persistently low center time across the session can signal prolonged anxiety, fear generalization, or a trait-like avoidance phenotype.
To validate the significance of center time percentage, it should be examined alongside results from other anxiety-related tests such as the Elevated Plus Maze, Light-Dark Box, or Novelty Suppressed Feeding. Concordance across paradigms supports the reliability of center time as a trait marker, while discordance may indicate task-specific reactivity or behavioral dissociation.
When paired with high-resolution scoring of behavioral events such as rearing, grooming, defecation, or immobility, center time offers a richer view of the animal’s internal state. For example, an animal that spends substantial time in the center while grooming may be coping with mild stress, while another that remains immobile in the periphery may be experiencing more severe anxiety. Microstructure analysis aids in decoding the complexity behind spatial behavior.
Animals naturally vary in their exploratory style. By analyzing percentage of center time across subjects, researchers can identify behavioral subgroups—such as consistently bold individuals who frequently explore the center versus cautious animals that remain along the periphery. These classifications can be used to examine predictors of drug response, resilience to stress, or vulnerability to neuropsychiatric disorders.
In studies with large cohorts or multiple behavioral variables, machine learning techniques such as hierarchical clustering or principal component analysis can incorporate center time percentage to discover novel phenotypic groupings. These data-driven approaches help uncover latent dimensions of behavior that may not be visible through univariate analyses alone.
Total locomotion helps contextualize center time. Low percentage values in animals with minimal movement may reflect sedation or fatigue, while similar values in high-mobility subjects suggest deliberate avoidance. This metric helps distinguish emotional versus motor causes of low center engagement.
This measure indicates how often the animal initiates exploration of the center zone. When combined with percentage of time, it differentiates between frequent but brief visits (indicative of anxiety or impulsivity) versus fewer but sustained center engagements (suggesting comfort and behavioral confidence).
The delay before the first center entry reflects initial threat appraisal. Longer latencies may be associated with heightened fear or low motivation, while shorter latencies are typically linked to exploratory drive or low anxiety.
Time spent hugging the walls offers a spatial counterbalance to center metrics. High thigmotaxis and low center time jointly support an interpretation of strong avoidance behavior. This inverse relationship helps triangulate affective and motivational states.
By expressing center zone activity as a proportion of total trial time, researchers gain a metric that is resistant to session variability and more readily comparable across time, treatment, and model conditions. This normalized measure enhances reproducibility and statistical power, particularly in multi-cohort or cross-laboratory designs.
For experimental designs aimed at assessing anxiety, exploratory strategy, or affective state, the percentage of time spent in the center offers one of the most robust and interpretable measures available in the Open Field Test.
Written by researchers, for researchers — powered by Conduct Science.


Monday – Friday
9 AM – 5 PM EST
DISCLAIMER: ConductScience and affiliate products are NOT designed for human consumption, testing, or clinical utilization. They are designed for pre-clinical utilization only. Customers purchasing apparatus for the purposes of scientific research or veterinary care affirm adherence to applicable regulatory bodies for the country in which their research or care is conducted.