
Data science is an emerging field of study which has multidimensional scope and roots in all industries. It has come up as an emerging realm of scientific methods that have combined the techniques of statistics, machine learning [also known as artificial intelligence (AI)], and mathematics under one umbrella to solve the once complex problems. It gives you insights into the emerging trends and patterns in a specific model with the help of data that is analyzed, and predictions are made.
Data science is the talk of the town, especially the healthcare corridors. Every industry has incorporated it to gain predictive measures that can boost their systems. (Helleputte, Gruson, Gruson, and Rousseau, 2016)
Before we proceed to the basic tools and techniques of data science, let us have a brief understanding of the very relevant concept called big data.
Big data is a term used in data science, which refers to the huge amount of data that has been collected to be used for research and analysis. It goes through various processes, such as it is first picked, stored, filtered, classified, validated, analyzed, and then processed for final visualization. (Ngiam and Khor, 2019)
The tools and techniques of data science are two different things. Techniques are a set of procedures that are followed to perform a task, whereas a tool is equipment that is used to apply that technique to perform a task.
Data scientists apply some operational methods, which are called the techniques on the data through various software, which are known as tools. This combination is used in acquiring data, refining it for the purpose intended, manipulating and labeling, and then examining the results for the best possible outcomes.
These methods used by the data scientists and engineers are inclusive of all the operations starting from the collection of data to storing and manipulating it, performing statistical analysis on it, and visualization with the help of bars and charts, and preparing predictive models for insights.
These processes are attained with the help of several tools and techniques which are extracted from the three subjects mentioned above.
The lifecycle of a data science project is composed of various stages. Data passes through each stage and is then transformed into information required by the respective field. Here we will have a look at the most efficient, quick, and productive tools and techniques used by the data scientists to accomplish their task at each stage.
What mathematical and statistical techniques do you need to learn for data science? There are a number of these techniques used in data science for data collection, modification, storage, analysis, insights, and then representation. The data analysts and scientists mostly work on the following statistical analyzing techniques that follow as:
Although the list doesn’t end here, if you have studied statistics and mathematics, you will have an idea of how the theories and techniques of samplings and correlations work. Particularly when you work as a data scientist and need to conclude, research on the patterns, targeted insight, etc. (Sivarajah, Kamal, Irani, and Weerakkody, 2017)
Let us start exploring the tools which are used to work on data in different processes. As mentioned earlier, data does go through a lot of processes in which it is collected, stored, worked upon, and analyzed.
For your easy understanding, the tools defined here are categorized according to their processes. The first process is data collection. Although data can be collected through various methods, which include online surveys, interviews, forms, etc., the information gathered has to be transformed into a readable form for the data analyst to work on. The following tools can be used for data collection.
Semantria is a cloud-based tool that extracts data and information through analyzing the text and sentiments in it. It is a high-end NLP (neuro-linguistic programming) based tool that can detect the sentiments on specific elements based on the language used in it (sounds like magic? No, it is science!).
It is yet another tool that collects data, especially on social media platforms, by tracking the feedback on brands and products. It also works on sentiment analysis. It is a tool used for monitoring and can be of great value for marketing companies.
Today, many other apps use similar text /semantics analysis and content management, e.g., Open Text, Opinion Crawl.
These tools are used to store a huge amount of data – which is typically stored in shared computers – and interact with it. These tools provide a platform to unite servers so that data can be assessed easily.
It is a framework for software that deals with huge data volume and its computation. It provides a layered structure to distribute the storage of data among clusters of computers for easy data processing of big data.
This tool is free and an open-source platform. It uses SQL and CSL (Cassandra structure language) to communicate with the database. It can provide swift availability of data stored on various servers.
It is a database that is document-oriented and also free to use. It is available on multiple platforms like Windows, Solaris, and Linux. It is very easy to learn and is reliable.
Similar data storage platforms are CouchDB, Apache Ignite, and Oracle NoSQL Database.
Data extraction tools are also known as web scraping tools. They are automated and extract information and data automatically from websites. The following tools can be used for data extraction.
It is a web scraping tool available in both free and paid versions. It gives data as output in structured spreadsheets, which are readable and easy to use for further operations on it. It can extract phone numbers, IP addresses, and email IDs along with different data from the websites.
It is also a web scraping tool but comes with advanced skills such as debugging and error handling. It can extract data from almost every website and provide structured data as output in user preferred formats.
Similar tools are Mozenda, Pentaho, and import.io.
Integrated with databases, data cleaning tools are time-saving and reduce the time consumption by searching, sorting, and filtering data to be used by the data analysts. The refined data becomes easy to use and is relevant. (Blei and Smyth, 2017)
Data cleaner works with the Hadoop database and is a very powerful data indexing tool. It improves the quality of data by removing duplicates and transforming them into one record. It can also find missing patterns and a specific data group.
This refining tool deals with tangled data. It cleans before transforming it into another form. It provides data access with speed and ease.
Similar data cleaning tools are MapReduce, Rapidminer, and Talend.
Data analysis tools not only analyze the data but also perform certain operations on the data. These tools inspect the data and study data modeling to draw useful information out of the data, which is conclusive and helps in decision-making for a certain problem or query.
The R programming language is the widely used programming language that is used by software engineers to develop software that helps in statistical computing and graphics too. It supports various platforms like Windows, Mac operating system, and Linux. It is widely used by data analysts, statisticians, and researchers.
Apache Spark is a powerful analytical engine that provides real-time analysis and processes data along with enabling mini and micro-batches and streaming. It is productive as it provides workflows that are highly interactive.
Python has been a very powerful and high-level programming language that has been around for quite a while. It was used for application development, but now it has been upgraded with new tools to be used, especially with data science. It gives output files that can be saved as CSV formats and used as spreadsheets.
Similar data analysis tools are Apache storm, SAS, Flink, Hive, etc.
Data visualization tools are used to present data in a graphical representation for clear insight. Many visualization tools are a combination of previous functions we discussed and can also support data extraction and analysis along with visualization.
Python, as mentioned above, is a powerful and general-purpose programming language that also provides data visualization. It is packed with vast graphical libraries to support the graphical representation of a wide variety of data.
Having a very large consumer market, Tableau is referred to as the grandmaster of all visualization software by Forbes. It is open-source software that can be integrated with the database, is easy to use, and furnishes interactive data visualization in the form of bars, charts, and maps.
Orange also happens to be an open-source data visualization tool supporting data extraction, data analysis, and machine learning. It does not require programming but rather has an interactive and user-friendly graphical user interface that displays the data in the form of bar charts, networks, heat maps, scatter plots, and trees.
Google Fusion Table
It is a web service powered by Google, which can be easily used by non-programmers for collecting data. You can upload your data in the form of CSV files and save them too. It looks more like an excel spreadsheet and allows editing by which you can see real-time changes in visualizations. It displays data in the form of pie charts, bars, timelines, line plots, and scatter plots. It allows you to link the data tables to your websites. You can also create a map based on your data, which can be further modified by coloring and can also be shared.
Similar popular data visualization apps and tools are DataWrapper, Qlik, and Gephi, which are all open source and also support CSV files as data input.
Every industry needs advancement in its systems to deal with new emerging problems, especially the health industry, which continuously needs enormous data for research and experiment to study the patterns of new diseases and develop medicines to counter them.
Although the currently available techniques and tools address the industrial problems, some corners are still left untouched. However, with the development and progress in artificial intelligence, the tools will also keep advancing to cope with the new and critical problems, and the older ones will become obsolete. These uncured portions will keep motivating the information technology to produce and discover more techniques and advancements.
In behavioral neuroscience, the Open Field Test (OFT) remains one of the most widely used assays to evaluate rodent models of affect, cognition, and motivation. It provides a non-invasive framework for examining how animals respond to novelty, stress, and pharmacological or environmental manipulations. Among the test’s core metrics, the percentage of time spent in the center zone offers a uniquely normalized and sensitive measure of an animal’s emotional reactivity and willingness to engage with a potentially risky environment.
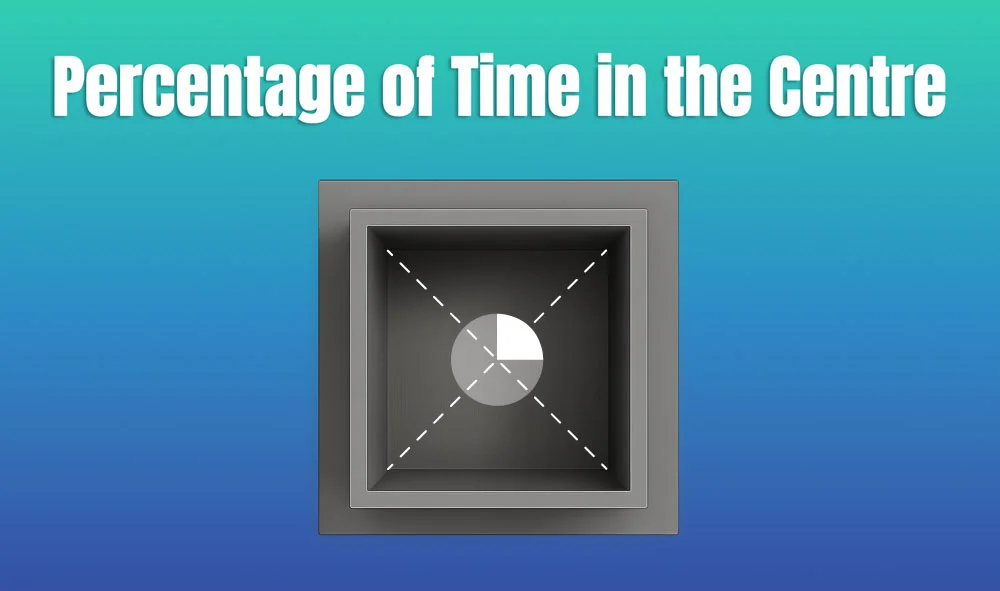
This metric is calculated as the proportion of time spent in the central area of the arena—typically the inner 25%—relative to the entire session duration. By normalizing this value, researchers gain a behaviorally informative variable that is resilient to fluctuations in session length or overall movement levels. This makes it especially valuable in comparative analyses, longitudinal monitoring, and cross-model validation.
Unlike raw center duration, which can be affected by trial design inconsistencies, the percentage-based measure enables clearer comparisons across animals, treatments, and conditions. It plays a key role in identifying trait anxiety, avoidance behavior, risk-taking tendencies, and environmental adaptation, making it indispensable in both basic and translational research contexts.
Whereas simple center duration provides absolute time, the percentage-based metric introduces greater interpretability and reproducibility, especially when comparing different animal models, treatment conditions, or experimental setups. It is particularly effective for quantifying avoidance behaviors, risk assessment strategies, and trait anxiety profiles in both acute and longitudinal designs.
This metric reflects the relative amount of time an animal chooses to spend in the open, exposed portion of the arena—typically defined as the inner 25% of a square or circular enclosure. Because rodents innately prefer the periphery (thigmotaxis), time in the center is inversely associated with anxiety-like behavior. As such, this percentage is considered a sensitive, normalized index of:
Critically, because this metric is normalized by session duration, it accommodates variability in activity levels or testing conditions. This makes it especially suitable for comparing across individuals, treatment groups, or timepoints in longitudinal studies.
A high percentage of center time indicates reduced anxiety, increased novelty-seeking, or pharmacological modulation (e.g., anxiolysis). Conversely, a low percentage suggests emotional inhibition, behavioral avoidance, or contextual hypervigilance. reduced anxiety, increased novelty-seeking, or pharmacological modulation (e.g., anxiolysis). Conversely, a low percentage suggests emotional inhibition, behavioral avoidance, or contextual hypervigilance.
The percentage of center time is one of the most direct, unconditioned readouts of anxiety-like behavior in rodents. It is frequently reduced in models of PTSD, chronic stress, or early-life adversity, where animals exhibit persistent avoidance of the center due to heightened emotional reactivity. This metric can also distinguish between acute anxiety responses and enduring trait anxiety, especially in longitudinal or developmental studies. Its normalized nature makes it ideal for comparing across cohorts with variable locomotor profiles, helping researchers detect true affective changes rather than activity-based confounds.
Rodents that spend more time in the center zone typically exhibit broader and more flexible exploration strategies. This behavior reflects not only reduced anxiety but also cognitive engagement and environmental curiosity. High center percentage is associated with robust spatial learning, attentional scanning, and memory encoding functions, supported by coordinated activation in the prefrontal cortex, hippocampus, and basal forebrain. In contrast, reduced center engagement may signal spatial rigidity, attentional narrowing, or cognitive withdrawal, particularly in models of neurodegeneration or aging.
The open field test remains one of the most widely accepted platforms for testing anxiolytic and psychotropic drugs. The percentage of center time reliably increases following administration of anxiolytic agents such as benzodiazepines, SSRIs, and GABA-A receptor agonists. This metric serves as a sensitive and reproducible endpoint in preclinical dose-finding studies, mechanistic pharmacology, and compound screening pipelines. It also aids in differentiating true anxiolytic effects from sedation or motor suppression by integrating with other behavioral parameters like distance traveled and entry count (Prut & Belzung, 2003).
Sex-based differences in emotional regulation often manifest in open field behavior, with female rodents generally exhibiting higher variability in center zone metrics due to hormonal cycling. For example, estrogen has been shown to facilitate exploratory behavior and increase center occupancy, while progesterone and stress-induced corticosterone often reduce it. Studies involving gonadectomy, hormone replacement, or sex-specific genetic knockouts use this metric to quantify the impact of endocrine factors on anxiety and exploratory behavior. As such, it remains a vital tool for dissecting sex-dependent neurobehavioral dynamics.
The percentage of center time is one of the most direct, unconditioned readouts of anxiety-like behavior in rodents. It is frequently reduced in models of PTSD, chronic stress, or early-life adversity. Because it is normalized, this metric is especially helpful for distinguishing between genuine avoidance and low general activity.
Environmental Control: Uniformity in environmental conditions is essential. Lighting should be evenly diffused to avoid shadow bias, and noise should be minimized to prevent stress-induced variability. The arena must be cleaned between trials using odor-neutral solutions to eliminate scent trails or pheromone cues that may affect zone preference. Any variation in these conditions can introduce systematic bias in center zone behavior. Use consistent definitions of the center zone (commonly 25% of total area) to allow valid comparisons. Software-based segmentation enhances spatial precision.
Evaluating how center time evolves across the duration of a session—divided into early, middle, and late thirds—provides insight into behavioral transitions and adaptive responses. Animals may begin by avoiding the center, only to gradually increase center time as they habituate to the environment. Conversely, persistently low center time across the session can signal prolonged anxiety, fear generalization, or a trait-like avoidance phenotype.
To validate the significance of center time percentage, it should be examined alongside results from other anxiety-related tests such as the Elevated Plus Maze, Light-Dark Box, or Novelty Suppressed Feeding. Concordance across paradigms supports the reliability of center time as a trait marker, while discordance may indicate task-specific reactivity or behavioral dissociation.
When paired with high-resolution scoring of behavioral events such as rearing, grooming, defecation, or immobility, center time offers a richer view of the animal’s internal state. For example, an animal that spends substantial time in the center while grooming may be coping with mild stress, while another that remains immobile in the periphery may be experiencing more severe anxiety. Microstructure analysis aids in decoding the complexity behind spatial behavior.
Animals naturally vary in their exploratory style. By analyzing percentage of center time across subjects, researchers can identify behavioral subgroups—such as consistently bold individuals who frequently explore the center versus cautious animals that remain along the periphery. These classifications can be used to examine predictors of drug response, resilience to stress, or vulnerability to neuropsychiatric disorders.
In studies with large cohorts or multiple behavioral variables, machine learning techniques such as hierarchical clustering or principal component analysis can incorporate center time percentage to discover novel phenotypic groupings. These data-driven approaches help uncover latent dimensions of behavior that may not be visible through univariate analyses alone.
Total locomotion helps contextualize center time. Low percentage values in animals with minimal movement may reflect sedation or fatigue, while similar values in high-mobility subjects suggest deliberate avoidance. This metric helps distinguish emotional versus motor causes of low center engagement.
This measure indicates how often the animal initiates exploration of the center zone. When combined with percentage of time, it differentiates between frequent but brief visits (indicative of anxiety or impulsivity) versus fewer but sustained center engagements (suggesting comfort and behavioral confidence).
The delay before the first center entry reflects initial threat appraisal. Longer latencies may be associated with heightened fear or low motivation, while shorter latencies are typically linked to exploratory drive or low anxiety.
Time spent hugging the walls offers a spatial counterbalance to center metrics. High thigmotaxis and low center time jointly support an interpretation of strong avoidance behavior. This inverse relationship helps triangulate affective and motivational states.
By expressing center zone activity as a proportion of total trial time, researchers gain a metric that is resistant to session variability and more readily comparable across time, treatment, and model conditions. This normalized measure enhances reproducibility and statistical power, particularly in multi-cohort or cross-laboratory designs.
For experimental designs aimed at assessing anxiety, exploratory strategy, or affective state, the percentage of time spent in the center offers one of the most robust and interpretable measures available in the Open Field Test.
Written by researchers, for researchers — powered by Conduct Science.


Monday – Friday
9 AM – 5 PM EST
DISCLAIMER: ConductScience and affiliate products are NOT designed for human consumption, testing, or clinical utilization. They are designed for pre-clinical utilization only. Customers purchasing apparatus for the purposes of scientific research or veterinary care affirm adherence to applicable regulatory bodies for the country in which their research or care is conducted.